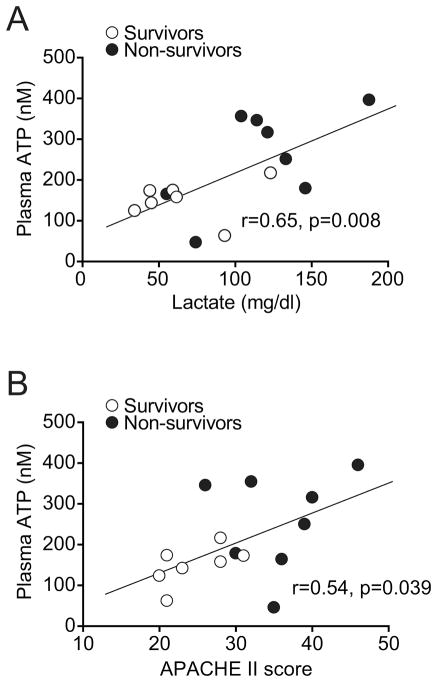
Fig. 2. Plasma ATP correlates with lactate levels and APACHE II scores.
(A) Plasma lactate levels were assessed in blood samples obtained immediately after return of spontaneous circulation. (B) APACHE II scores were assessed after ROSC and on admission of the patients to the intensive care unit. Both parameters were correlated with the corresponding plasma ATP concentrations. Correlation plots and the linear regression line are shown (n=15; white symbols: survivors; black symbols: non-survivor; r: Pearson’s correlation coefficient).

