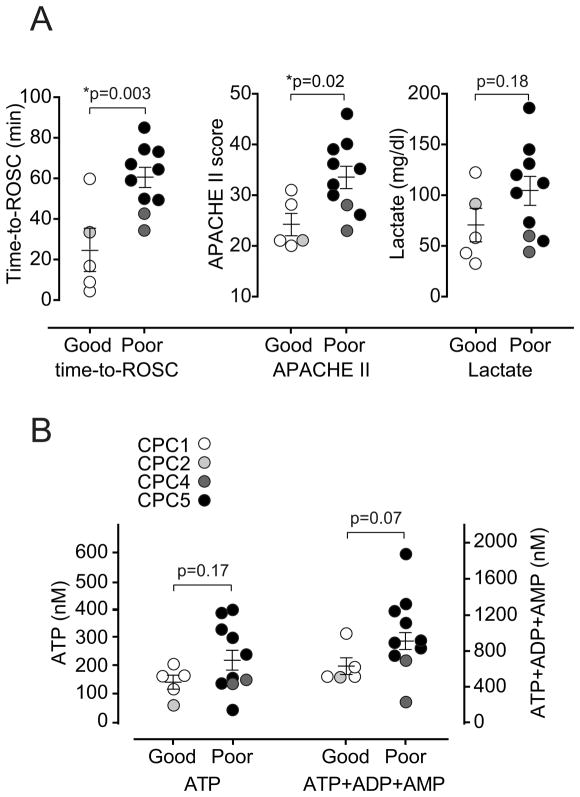
Fig. 4. Plasma adenylate levels as potential markers of outcome in PCAS patients.
PCAS patients were separated in two groups with good (CPC<3) and poor (CPC>3) neurological outcome and time-to-ROSC, plasma lactate levels, and APACHE II scores (panel A) or plasma ATP levels or the sum of plasma levels of ATP, ADP, and AMP (panel B) were compared. Each point shown represents an individual PCAS patient (open circles: CPC category 1; light gray circles: CPC category 2; dark gray circles: CPC category 4; black circles: CPC category 5). None of the patients fell in CPC category 3. Statistical analyses were done using unpaired two-tailed t test or the Mann-Whitney test for normally or not normally distributed data, respectively.

