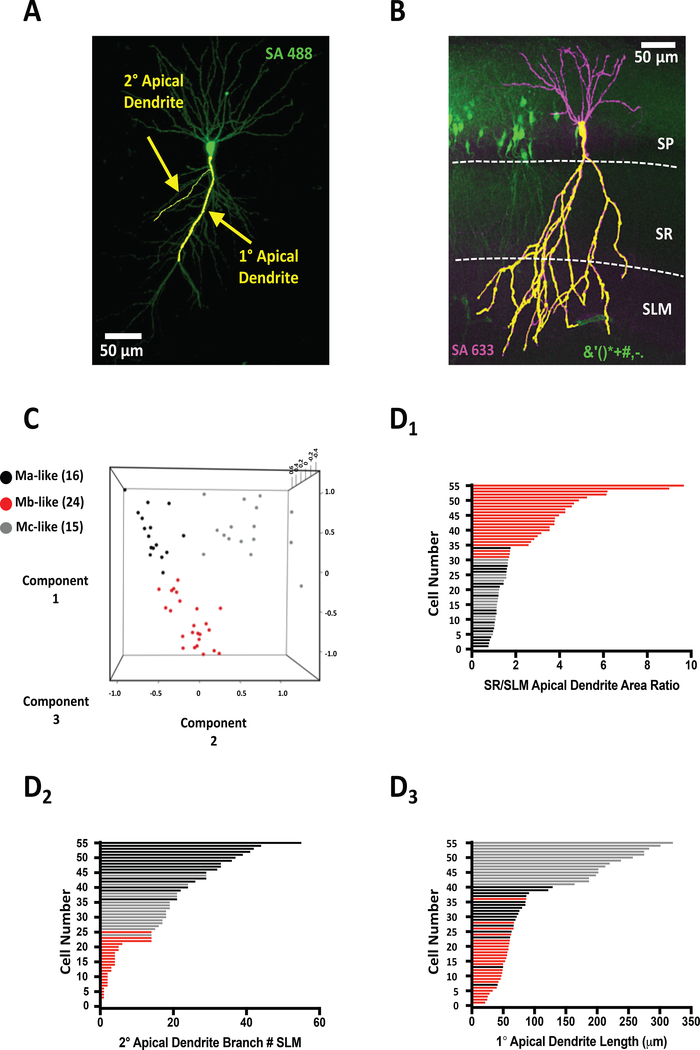
Figure 2.
Unsupervised machine learning reveals three morphologically distinct cell types. A) Representative confocal image of mouse CA2 pyramidal neuron with overlaid Imaris tracing of 1° and 2° apical dendrites. B) Representative confocal image of Amigo2-GFP+ CA2 pyramidal mouse neurons counter-stained with streptavidin (SA633) marking patched, biocytin-filled neuron. Measured apical dendrite area (1° and 2°) denoted by superimposed yellow apical dendritic tracing. Stratum pyramidal (SP), stratum radiatum (SR), and stratum lacunosum moleculare (SLM) layers are denoted by dashed white lines. C) 3D Scatter plot representing the principal component analysis (PCA) colored by the Kmeans clustering groups. PCA was performed using 1° Apical Dendrite Length (Component 1), 2° Branch SLM (Component 2), and SR SLM 2° Branch Ratio (Component 3). D) Plotting of all Ma-like (black bars), Mb-like (red bars), and Mc-like (gray bars) CA2 pyramidal neurons by either SR/SLM apical dendrite area ratio (D1), 2° apical dendrite branch number (D2), and 1° apical dendrite length (D3). Bar colors correspond to cell-type clusters indicated in PCA in C.

