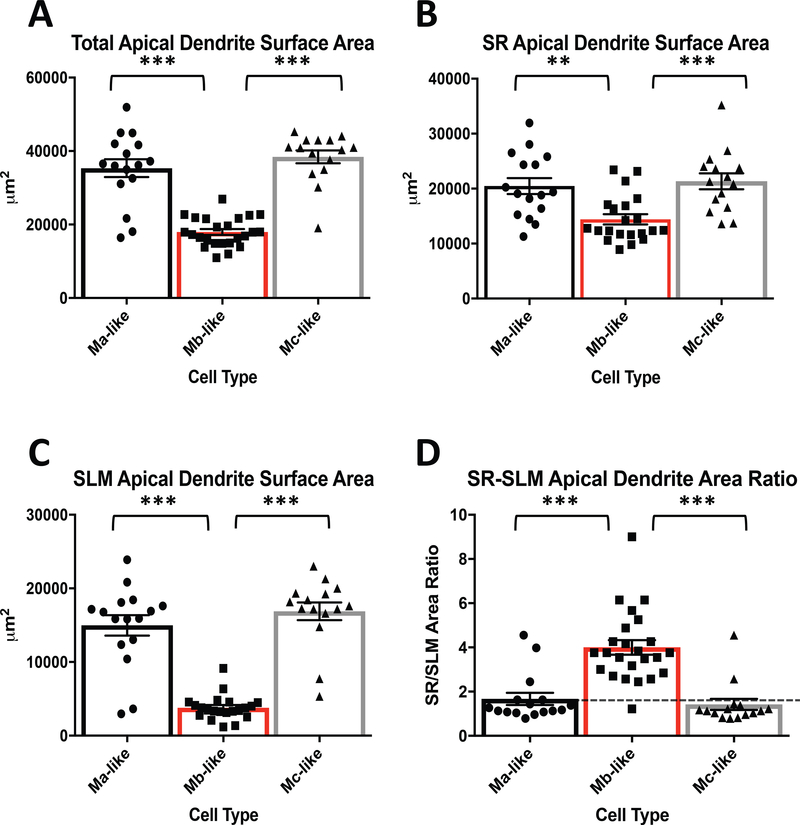
Figure 4.
Comparison of CA2 pyramidal cell apical dendrite areas based on cell type. A) Measured total apical dendrite surface areas for Ma-, Mb-, and Mc-like cells. Ma-vs. Mb-like and Mb- vs. Mc-like cell apical dendrite surface areas are significantly different (Table 1. N = 55, F(2, 52)= 52.5, P < 0.0001, 1 way ANOVA) while Ma-vs. Mc-like are not significantly different (Table 1. N = 55, F(2, 52)= 52.5, P = 0.4223, 1 way ANOVA). B) SR apical dendrite areas for Ma-, Mb-, and Mc-like cells. SR designated as area between stratum pyramidal (SP) and SLM. Ma-vs. Mb-like and Mb-vs. Mc-like are significantly different (Table 1. N = 55, F(2, 49)= 9.913, P = 0.0026 and 0.0007, respectively, 1 way ANOVA). Ma- and Mc-like cells are not significantly different (Table 1. N = 55, F(2, 49)= 9.913, P = 0.8871, 1 way ANOVA). See figure 1B for layer designations. C) SLM apical dendrite areas for Ma-, Mb-, and Mc-like cells. SLM designated as area below SR/SLM boundary (see figure 1B). Ma-vs. Mb-like and Mb- vs. Mc-like SLM apical dendrite areas are significantly different (Table 1. N = 55, F(2, 49)= 55.53, P < 0.0001, 1 way ANOVA) while Ma-vs. Mc-like apical dendrite areas are not different (Table 1. N = 55, F(2, 49)= 55.53, P = 0.4086, 1 way ANOVA). D) SR/SLM apical dendrite area ratio. Ratio based on values from B and C. Dotted line represents 1:1 ratio. Ma-vs. Mb-like and Mb- vs. Mc-like are significantly different (Table 1. N = 55, F(2, 52)= 23.61, P < 0.0001, 1 way ANOVA) while Ma-vs. Mc-like cells are not significantly different (Table 1. N = 55, F(2, 52)= 23.61, P = 0.8569, 1 way ANOVA).

