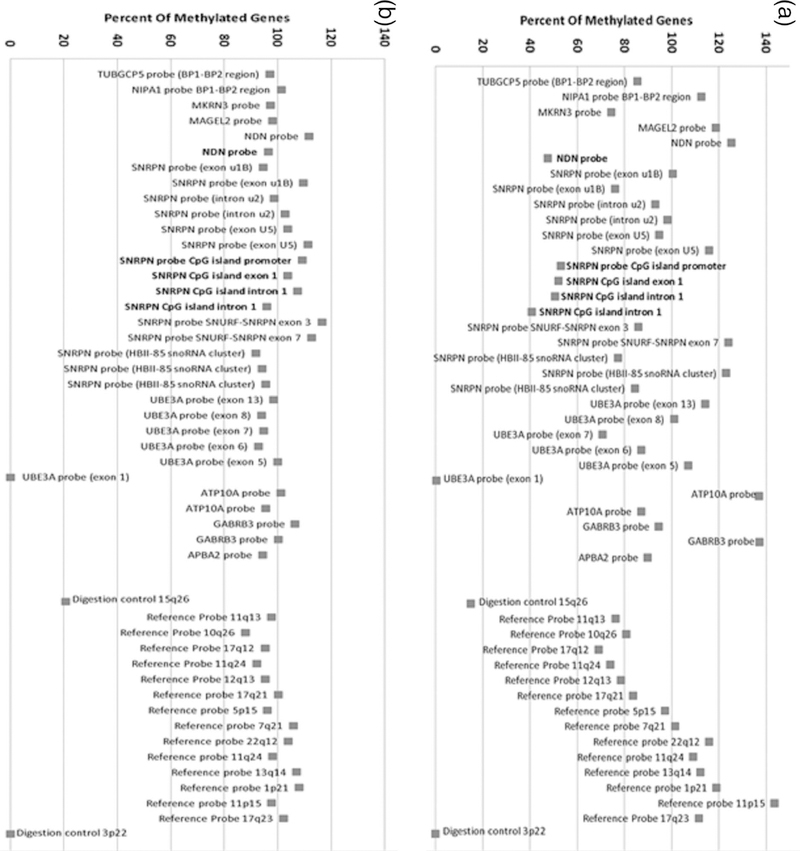
Figure 2.

Gene methylation status using MS-MLPA of a control subject (A) showing normal methylation status (about 50%) for five methylated probes (in bold) and a PWS subject (B) showing abnormal methylation status (about 100%) in the five methylated probes (in bold).
