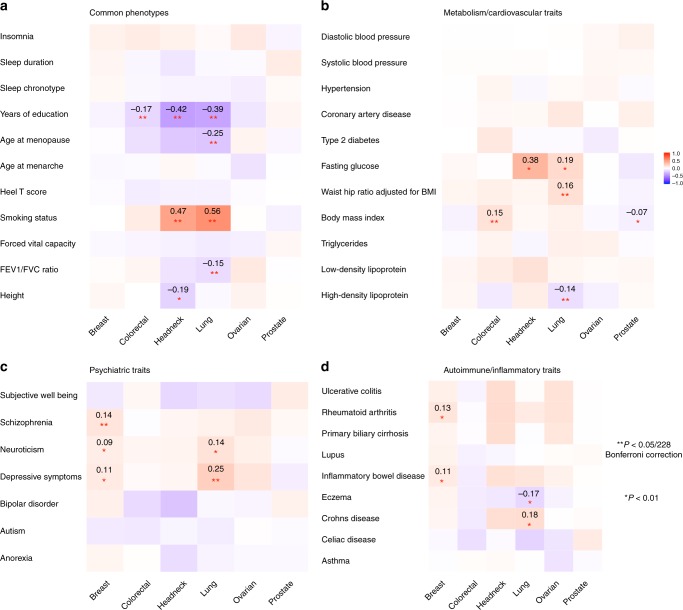
Fig. 3.
Cross-trait genetic correlation (rg) analysis between cancers and non-cancer traits. The traits were divided into four categories: a Common phenotypes, b Metabolic or cardiovascular related traits, c Psychiatric traits, d Autoimmune inflammatory diseases. Pair-wise genetic correlations withstood Bonferroni corrections (228 tests) are marked with double asterisk (**), with estimates of correlation shown in the cells. Pair-wise genetic correlations with significance at p < 0.01 are marked with a single asterisk (*). The color of cells represents the magnitude of correlation

