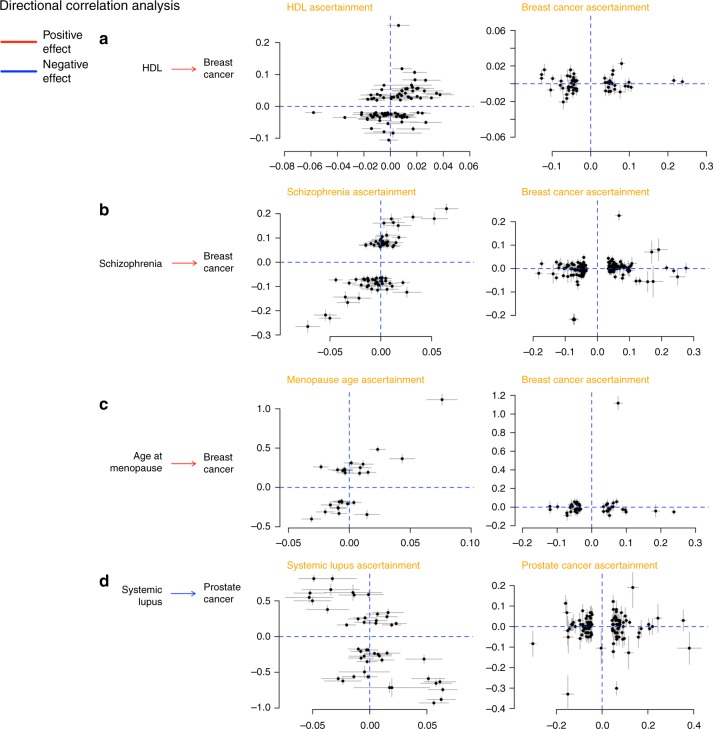
Fig. 4.
Putative directional relationships between cancers and traits. For each cancer–trait pair identified as candidates to be related in a causal manner, the plots show trait-specific effect sizes (beta coefficients) of the included genetic variants. Gray lines represent the relevant standard errors. a HDL and breast cancer. Trait-specific effect sizes for HDL and breast cancer are shown for SNPs associated with HDL levels (left) and breast cancer (right). b Schizophrenia and breast cancer. Trait-specific effect sizes for schizophrenia and breast cancer are shown for SNPs associated with schizophrenia (left) and breast cancer (right). c Age at natural menopause and breast cancer. Trait-specific effect sizes for age at natural menopause and breast cancer are shown for SNPs associated with age at natural menopause (left) and breast cancer (right). d Lupus and prostate cancer. Trait-specific effect sizes for lupus and prostate cancer are shown for SNPs associated with lupus (left) and prostate cancer (right)

