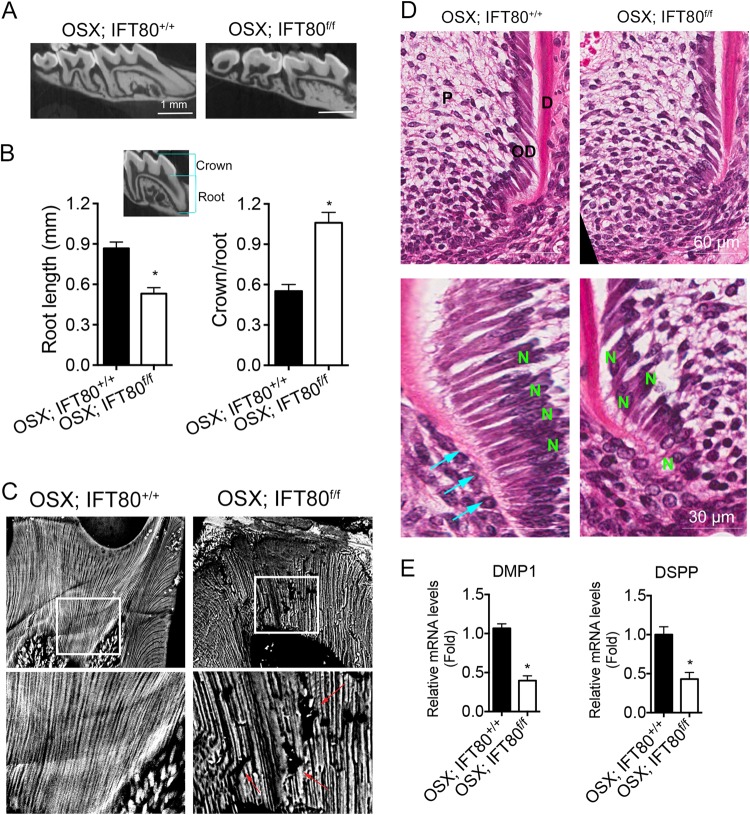
Fig. 3. OSX;IFT80f/f mice show shorter molar root, less mineralized dentin, and disrupted odontoblast differentiation.
a Micro-tomographic view of the molar root. Scale bars represent 1 mm. b Measured root length and calculated crown/root ratio (n = 3). c Backscattered electron analysis of dentin tubules and mineralization. Red arrows indicate defect of dentinal tubules. Lower panels are enlarged images of the boxed areas in upper panels. d Hematoxylin and eosin staining of the molar root. D dentin, OD odontoblasts, P pulp, N nucleus. In OSX;IFT80+/+ mice, the odontoblasts were highly polarized and attached to each other by their terminal webs (cyan arrow). Lower panels are enlarged images of upper panels. Scale bars represent 60 μm (upper) or 30 μm (lower). e Dentin matrix protein 1 (DMP1) and dentin sialophosphoprotein (DSPP) expression in the dental pulp. The expression of DMP1 and DSPP was normalized to GAPDH expression (n = 3). Data are expressed as mean ± SEM; *p < 0.0001

