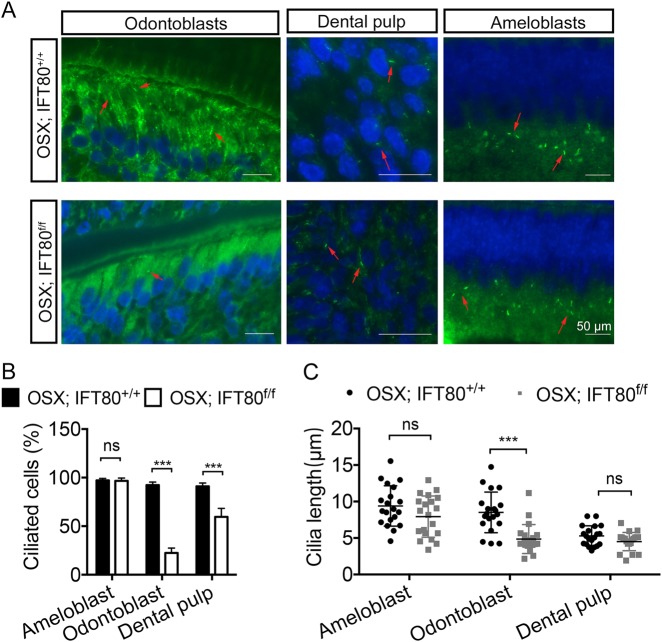
Fig. 4. Deletion of IFT80 disrupts cilia formation and Hh signaling transduction.
a Immunofluorescence analysis of primary cilia in molar section (red arrow). Primary cilia were stained with acetylated α-tubulin (green) antibody. DAPI is used as a counterstain. Scale bars represent 50 μm. b Calculated cilia percentage (n = 3 with at least 100 cells analyzed) is shown in a. c Calculated cilia length (n = 20 cells). Data are expressed as mean ± SEM; ns, not statistically significant; ***p < 0.0001

