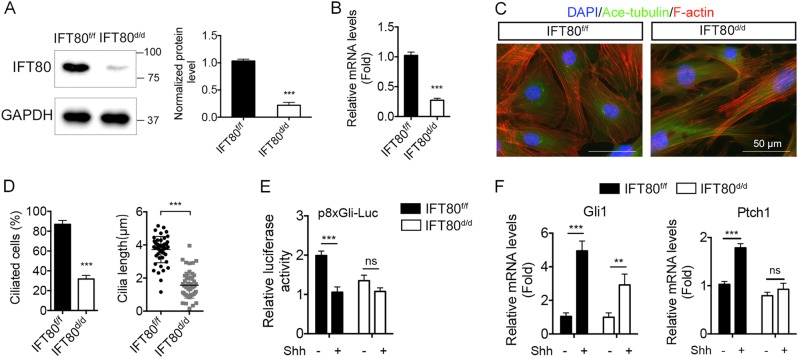
Fig. 5. Deletion of IFT80 disrupted cilia formation as well as Hh signaling in DPSCs.
a Western blot analysis of IFT80 expression in IFT80f/f and IFT80d/d DPSCs. IFT80 protein level is normalized to GAPDH (n = 3). b qPCR analysis of IFT80 expression in IFT80f/f and IFT80d/d DPSCs. IFT80 expression is normalized to GAPDH (n = 3, triplicates per group). c Immunofluorescence analysis of primary cilia in IFT80f/f and IFT80d/d DPSCs. Primary cilia were stained with acetylated α-tubulin (green) antibody. Stress fibers were stained with Alexa Fluor 568 Phalloidin (red). DAPI staining is used as counterstaining. Scale bars represent 50 μm. d Calculated cilia length (n = 20 cells) and cilia percentage (n = 3 with at least 200 cells analyzed). e Reporter assay showing 8×Gli-responsive luciferase (p8×Gli-Luc) activity in IFT80f/f and IFT80d/d DPSCs with or without sonic Hh (Shh. 1 μg/mL) stimulation (n = 3, triplicates per group). f qPCR results showing Ptch1 and Gli1 expression in IFT80f/f and IFT80d/d DPSCs with or without Shh stimulation (n = 3, triplicates per group). Data are expressed as mean ± SEM; ns, not statistically significant; ***p < 0.0001; **p < 0.001

