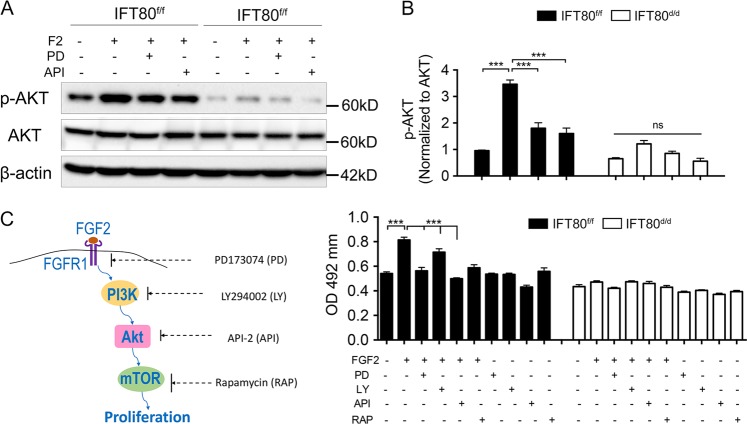
Fig. 7. Deletion of IFT80 inhibited DPSC proliferation via down-regulation of FGF2–FGFR1–PI3K–AKT signaling.
a Western blot analysis of AKT phosphorylation with FGF2 (10 ng/mL) stimulation in IFT80f/f and IFT80d/d DPSCs. AKT phosphorylation level is normalized to AKT (n = 3). PD PD173074 (1 μM); API API-2 (1 μM, AKT inhibitor). b Quantification of protein expression from a. AKT phosphorylation level was normalized AKT (n = 3). c Proliferation (MTS) assay of IFT80f/f and IFT80d/d DPSCs treated with FGF2 together with PD173074 (PD, 1 μM), LY294002 (LY, 15 μM, PI3K inhibitor), API-2 (API, 1 μM), or rapamycin (RAP, 0.5 μM, mTOR inhibitor). The starting cell density is 100 cells per mm2 (n = 3, triplicates per group). Data are expressed as mean ± SEM; ns, not statistically significant; ***p < 0.0001

