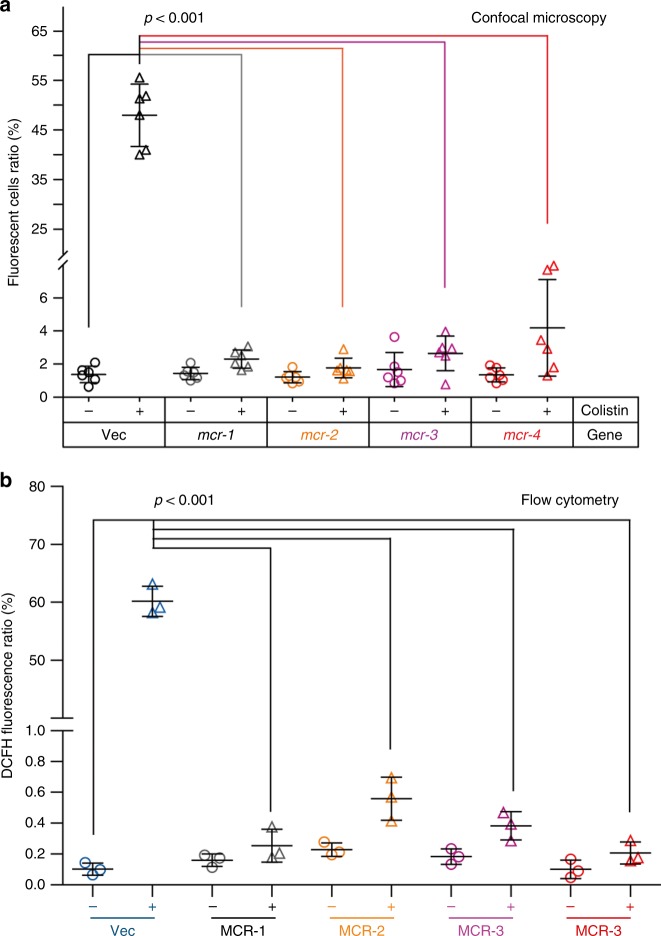
Fig. 7.
Relative quantification assays for colistin-induced ROS levels in E. coli expressing mcr-like genetic determinant. a Confocal microscopy-based quantification of ROS levels in E. coli carrying different versions of MCR family. b Use of flow cytometry to determine the ROS fluctuation in E. coli having mcr variants. The ratio of fluorescent cells (a) was calculated by counting the number of cells with/without fluorescence (seen in Supplementary Figure 10). Over 500 cells from 6 individual photographs were counted for each group. The data was given after one-way analysis of variance (ANOVA) along with Tukey–Kramer multiple comparisons post hoc test36. Statistical significance was set at p < 0.001. The flow cytometry data (b) was recorded with a BD FACSVerse flow cytometer counting 10,000 cells at a flow rate of 35 ml/min or 14 ml/min. DCFH florescence was excited with a 488 nm argon laser and emission was detected with the FL1 emission filter at 525 nm using FL1 photomultiplier tube

