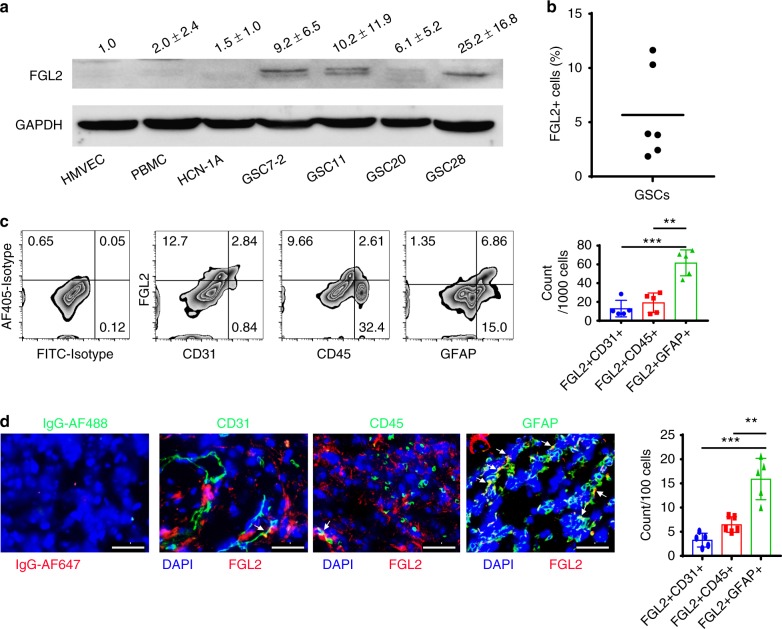
Fig. 1.
FGL2 is expressed by glioma cells. a FGL2 protein levels were detected by western blot in human peripheral blood monocytes (PBMCs) from healthy donors, normal endothelial cells (HMVECs), normal neurons (HCN-1A), and four glioma stem cell lines (GSC7-2, GSC11, GSC20, and GSC28). Western blots shown are representative, and quantities are summarized as ratio changes from three independent experiments. Glyceraldehyde 3-phosphate dehydrogenase (GAPDH) was used as a protein-loading control. b Percentage of FGL2+ cells in cultured human GSCs. c Representative flow cytometry plots of FGL2 expression on CD45+, CD31+, or GFAP+ cells from tumors of patients with newly diagnosed GBM. Data (n = 5) are presented as the mean ± S.D. and analyzed by one-way ANOVA. d Sections of clinical GBM samples were double stained for co-expression of FGL2 (red) and GFAP (green), or of FGL2 (red) and CD45 (green), or of FGL2 (red) and CD31 (green). Nuclei were counterstained with DAPI (blue). White arrows point to co-localization. Scale bars, 50 μm. Data are presented as the mean ± S.D., and representative images are shown (n = 5). A one-way ANOVA was used to calculate the two-sided P values. Significant results were presented as **P < 0.01, ***P < 0.001

