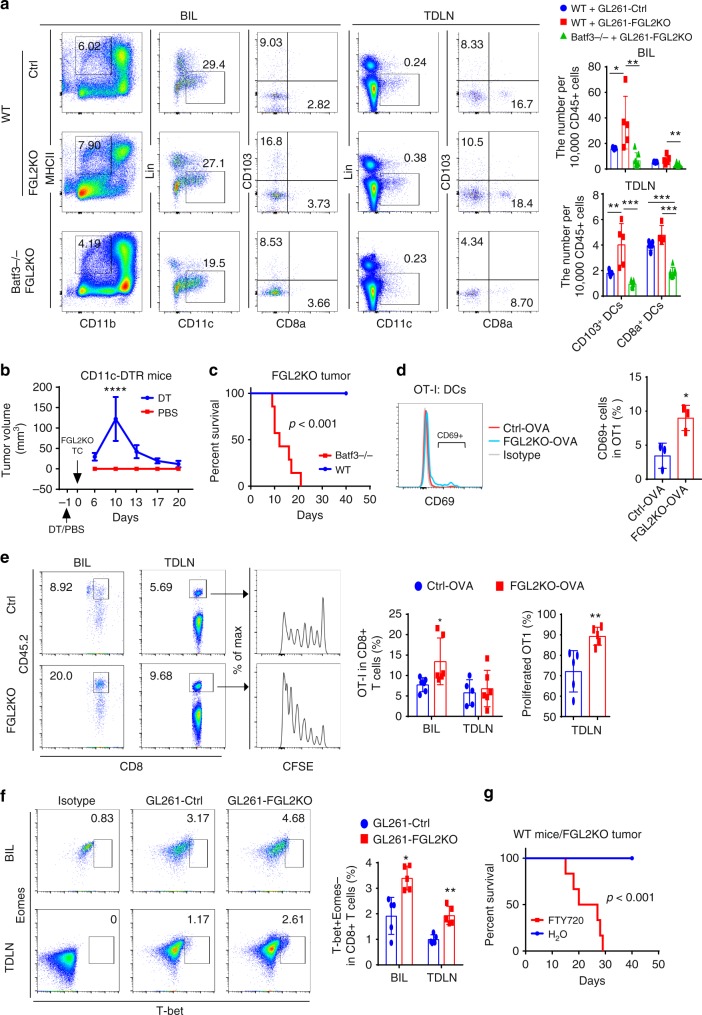
Fig. 4.
Batf3-dependent CD103+ dendritic cells are required for CD8+ T cells priming. a Brain-infiltrating leukocytes (BIL) and tumor-draining lymph nodes (TDLNs) of Ctrl or FGL2KO tumor-bearing wild-type (WT) mice and FGL2KO tumor-bearing Batf3−/− mice were analyzed for CD103+/CD8a+ dendritic cell (DCs) populations on day 7 post tumor implantation. Data are presented as the mean ± S.D. and were analyzed by one-way ANOVA (n = 5–7 per group). b FGL2KO tumor progression in CD11c-DTR mice treated with diphtheria toxin (DT) or PBS. FGL2KO tumor cells were implanted subcutaneously into CD11c-DTR mice on day 1 after injection of DT or PBS. Data are presented as the mean ± S.D. (n = 8 per group). c Survival analysis of Batf3−/− mice implanted with GL261-FGL2KO tumor cells (n = 7 per group). d FACS assay of CD69 on naive OT-I CD8+ T cells co-cultured with DCs isolated from tumors at a ratio of 1:2. Data are presented as the mean ± S.D. (n = 3 mice per group) and were analyzed by t-test. e Abundance and proliferation of CFSE-labeled OT-I cells in brains and TDLNs of GL261-Ctrl-OVA or GL261-FGL2KO-OVA tumor-bearing mice. CFSE-labeled OT-I cells were adoptively transferred to tumor-bearing CD45.1 mice on day 2 after tumor implantation. Brains and TDLNs were collected 5 days later for analyzing the presence and proliferation of the CD45.2+CD8+ T cell population. Data are presented as the mean ± S.D. (n = 5-6 per group) and were analyzed by t-test. f Representative cytometric analysis of CD8+ T cell priming (CD8+T-bet+Eomes−) in BIL and TDLNs at 7 days after tumor implantation. Data are presented as the mean ± S.D. (n = 5 per group) and were analyzed by t-test. g Survival analysis of WT mice implanted with GL261-FGL2KO tumor cells treated with FTY720. Mice were treated with 1 mg/kg FTY720 1 h before tumor-cell implantation and were maintained with drinking water containing 2 μg/mL FTY720 for the duration of the experiment (n = 6 per group). All data are representative of at least two independent experiments. The survival curves were analyzed by Kaplan–Meier analysis and the log-rank test was used to compare overall survival between groups. Significant results were presented as *P < 0.05, **P < 0.01, ***P < 0.001

