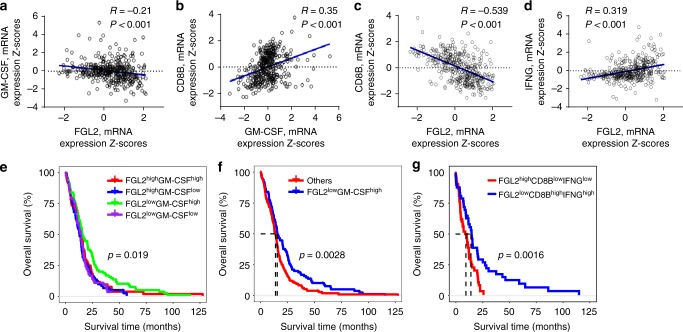
Fig. 7.
Expression level of FGL2 and GM-CSF predicts outcome in GBM patients. Data on survival of GBM patients and gene mRNA expression data (n = 401 patients) were downloaded and retrieved from the TCGA data portal ([http://www.cbioportal.org/public-portal/] Accessed between January 1, 2018, and March 15, 2018). The expression levels for both genes were categorized as high or low using median values as the cutoffs. a–d Correlations analysis of mRNA expression levels among FGL2, GM-CSF, CD8B, and IFNG in GBM tumors analyzed using the Pearson correlation coefficient. R = Pearson correlation coefficient. e Kaplan–Meier survival analysis for OS of GBM patients in the TCGA dataset grouped by expression levels of FGL2 and GM-CSF mRNA. Patients’ tumors were classified as FGL2highGM-CSFlow, FGL2highGM-CSFhigh, FGL2lowGM-CSFlow, or FGL2lowGM-CSFhigh. The log-rank test was used to compare overall survival among groups. f Kaplan–Meier survival analysis for OS of GBM patients in the FGL2lowGM-CSFhigh group vs. all others. The log-rank test was used to compare overall survival between groups. g Kaplan–Meier survival analysis for OS of GBM patients in the FGL2lowCD8BhighIFNGhigh group vs. those in the FGL2highCD8BlowIFNGlow group. The log-rank test was used to compare overall survival between groups. The statistical analyses were conducted using the R software package

