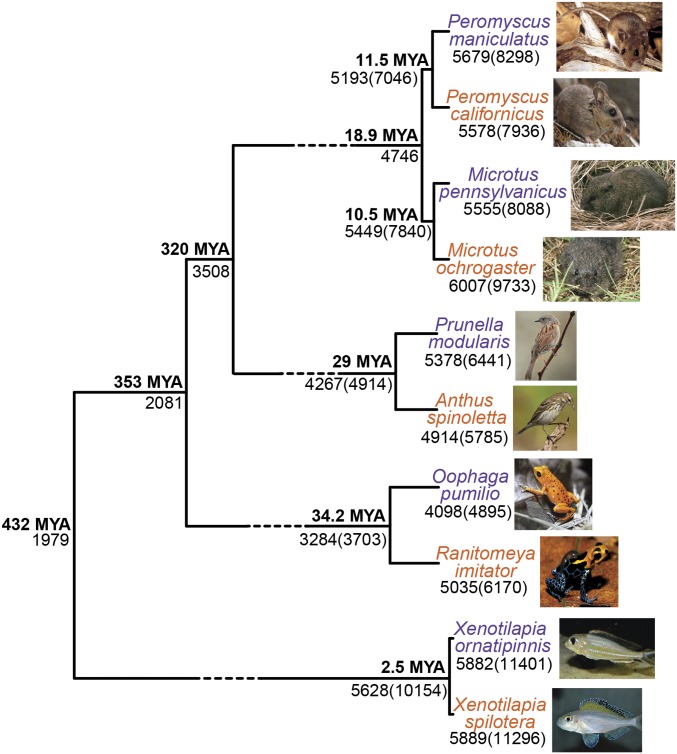
Fig. 1.
Representative species exhibiting monogamous mating systems (including forming pair bonds, engaging in biparental care, and defending territory) were included in the analysis. To reduce clade-specific gene expression patterns and identify neural expression patterns associated with a monogamous mating system, monogamous species were paired with a closely related nonmonogamous species. Monogamous species for each clade are shown in orange, and nonmonogamous are shown in purple. Genes were grouped into OGGs using orthoMCL (44). Of the 6,125 OGGs identified across clades, the number of OGGs and genes in parentheses with expression data are shown at each tip (SI Appendix, Table S3). The number of shared OGGs and genes in parentheses (for species pairs) at each node are shown. Median divergence estimate was obtained from TimeTree (SI Appendix, Table S5) (46). Dashed branch lengths are not drawn to scale.

