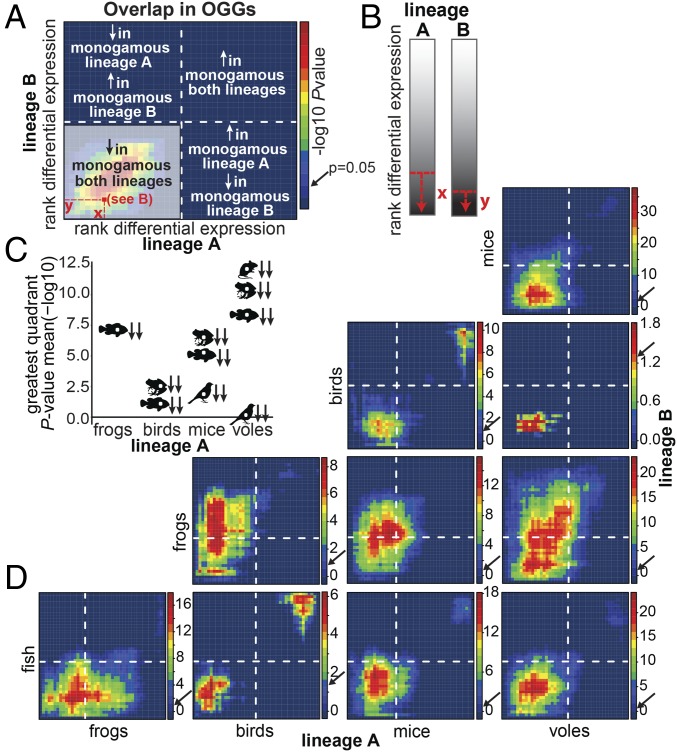
Fig. 4.
RRHO of monogamy-related log2 fold-differences in gene expression for the 1,979 OGGs identified across all clades. Ranked log2 fold-differences in monogamous vs. nonmonogamous mRNA levels are binned into 44 sets of 45 OGGs from the most down-regulated to the most up-regulated in the monogamous species of each clade. OGG set overlap is compared in four quadrants defined by the transition between down- and up-regulation in each clade (A, dashed lines). The color of each pixel of the matrix (A, red square) indicates the enrichment in OGG set overlap at and above that differential expression threshold (B) and is expressed as the negative log10 of the Benjamini–Yekutieli-corrected P value. Significance of the enrichment is indicated by the pixel color with warm colors indicating increased enrichment. For each pairwise comparison of clades, the strength of OGG set overlap is summarized as the most significant quadrant mean negative log10 of the BY-corrected (C). Mean, median, and maximum P values for each quadrant are provided in SI Appendix, Table S6. Arrows next to the silhouettes indicate the directionality in lineage A (first) and lineage B (second) (C). RRHO analyses are shown for each pairwise clade comparison (D). Negative log10 of the BY-corrected P value color scale varies across plots. Dashed lines indicate the position of the switch point from down- to up-regulation in the monogamous species of each clade. Arrows on the color scale indicate the color at P value = 0.05.

