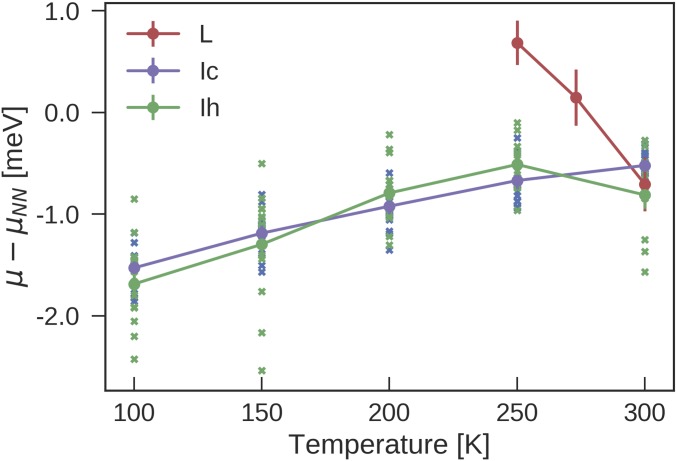
Fig. 3.
The difference in the chemical potential between revPBE0-D3 and NN-based MD simulations at . Standard errors of the mean are indicated by the error bars. The violet (green) crosses indicate the results from 16 different 64-molecule proton-orderings of Ic (Ih). The violet (green) line shows the average across proton orderings.

