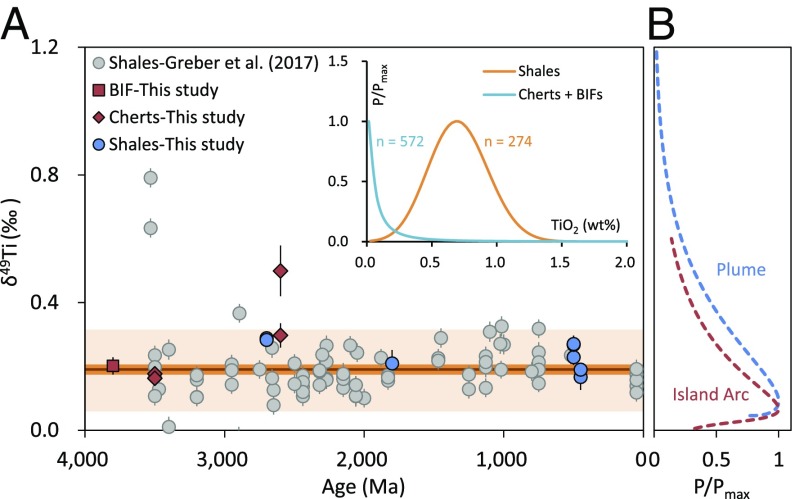
Fig. 3.
(A) The δ49Ti values of Archean BIF, cherts, and shales versus depositional ages and previous data for shales (1) (Dataset S7). The dark orange line shows the average δ49Ti value of ∼+0.191‰ for the present data, with the orange and light orange areas showing 2 SE (±0.013‰) and 2 SD (±0.119‰) of these data, respectively. The Inset shows the distribution of the literature TiO2 contents in BIFs, cherts, and shales with the probabilities normalized to the maximal probability (P/Pmax) (Dataset S8). (B) Distribution of the δ49Ti values for plume and island arc rocks in the GeoRoc database. The samples were compiled into groups in each 0.5 wt % SiO2 interval following Gaussian distribution (SI Appendix, Fig. S2). This SiO2 distribution was further translated into the δ49Ti density based on the δ49Ti-SiO2 systematics for plume settings (this study) and island arc settings (1).

