Fig. 4.
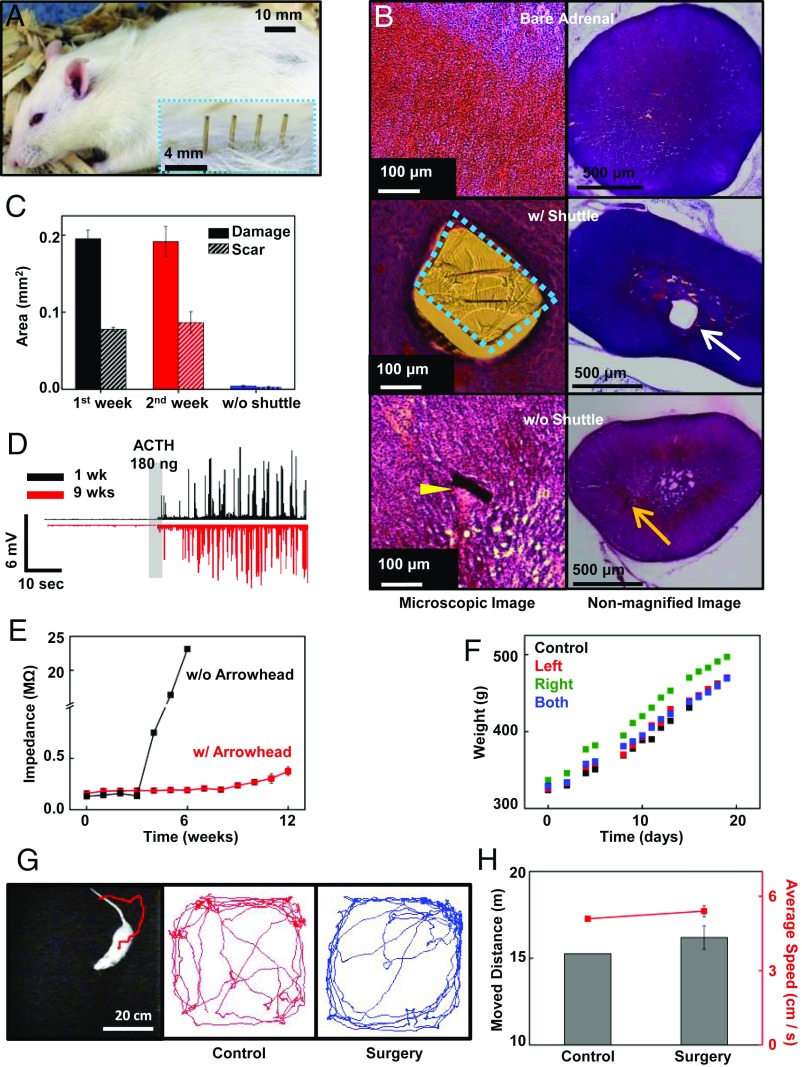
Biocompatibility test for the adrenal probe. (A) The rat was fully recovered only 2 wk after surgery. Inset shows the magnified image of the pins of the connector after brief shaving. (B) The microscopic image of the H&E stained adrenal gland slice and camera image of the slice with (Middle) and without (Bottom) shuttle. The image shows the control adrenal slice that had not implanted any probe (Top). We observed a large dissipation of the tissue and scar around the shuttle (blue dashed box and white arrow) remained in the adrenal (Middle). In contrast, there is no noticeable damage around the remaining thin (a few micrometers) probe (yellow arrow), and the penetrated tissue is fully recovered (Bottom). In the camera image, the SU-8−based shuttle is clearly observed in the tissue, while there are no noticeable differences in the bare adrenal gland and adrenal gland without a shuttle. (C) Cross-sectional area of the damaged tissue area was measured with computer software. Tissue with shuttle showed a large dissipated area and scar tissue, while there was no clear damage in the tissue without shuttle. (D) The spikes of the adrenal cortex collected for long-term implantation. There were no significant differences before and after ACTH injection between 1 wk after implantation (black) and 9 wk after implantation (red). (E) Comparison of the impedance of the flexible arrowhead anchor probe with a conventional rigid probe. The impedance of the rigid probe increased rapidly around 4 wk after implantation (black) by the device breakage, while the impedance of the arrowhead probe was maintained for 13 wk after implantation (red). (F) The time course animal body weight changes. The body weights of the control group (black), left adrenal implant (red), right adrenal implant (green), and both adrenal implants (blue) show no noticeable differences over time. (G) Movement tracking of the rat with the implanted probe in the open-field cage (Left). The recorded trail of the animal movement within 5 min in the open-field cage of the control group (Middle) and the implanted group (Right). (H) Comparing the moved distance (bar, left axis) and the average velocity (red line, right axis) of the control group and implanted group of rats in the open-field cage.

