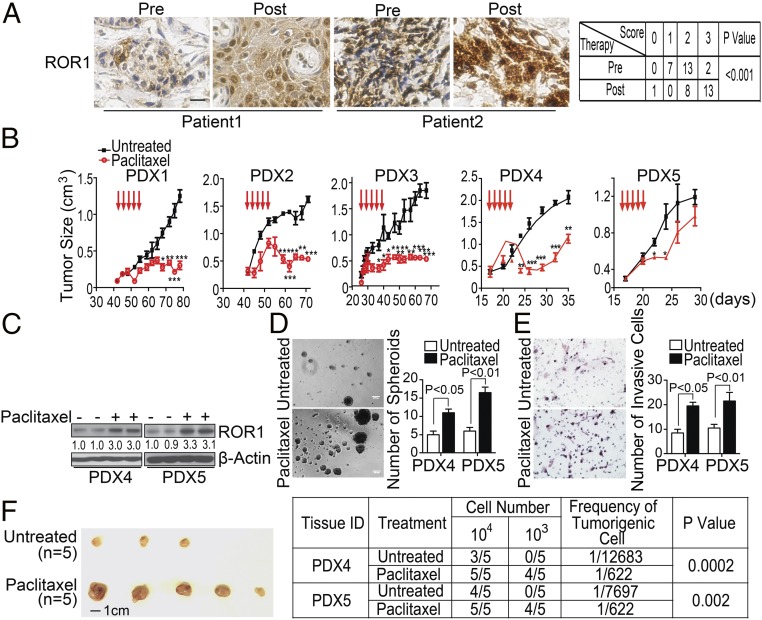
Fig. 1.
Chemotherapy enhances breast cancer expression of ROR1 and stemness. (A) Immunohistochemical staining of ROR1 in breast biopsy specimens obtained from patients (n = 22) before (Pre) or after (Post) therapy with docetaxel/epirubicin ± cyclophosphamide. (Scale bar: 25 µM.) The table to the Right shows the elevation of ROR1 on the breast cancer clinical specimens obtained from patients after chemotherapy treatment as assessed by Fisher’s exact test. (B) The graph depicts the mean tumor growth of breast cancer PDXs in animals that did not receive treatment (black line, n = 7) or had received paclitaxel (red line, n = 5) on the days indicated by the red arrows. (C) Lysates from PDX4 or PDX5 isolated from untreated mice (−) or mice treated with paclitaxel (+) were examined for ROR1 or β-actin, which served to monitor the amount of protein per lane. The numbers below each lane are the ratios of band densities of ROR1 to β-actin normalized to that for the PDXs isolated from untreated mice. (D and E) The histograms depict the average numbers of spheroids (D) or invading cells (E) from PDX4 or PDX5 excised from mice that did not receive treatment (open bars, n = 3) or that were treated with paclitaxel (black bars, n = 3) ± standard error of the mean (SEM). Representative photomicrographs to the Left of the histograms depict the spheroids or invasive cells of PDXs excised from untreated mice or from mice that received paclitaxel. (Scale bar: 100 µm.) (F) Tumor cells were isolated from PDX4 or PDX5 mice that did not receive treatment (Untreated) or were treated with paclitaxel (Paclitaxel) as indicated on the Left. Isolated tumor cells from each PDX were reimplanted into mice (n = 5), and the tumor incidence was recorded. The Left provides representative photographs for tumors isolated from untreated mice or from mice that received paclitaxel. The frequency of tumorigenic cells and the probability estimates are shown on the Right using the extreme limiting dilution analysis (ELDA) software.

