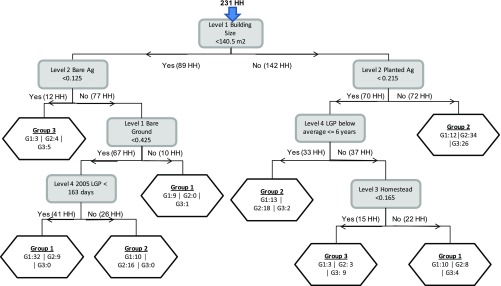
Fig. 2.
Tree derived from cross-validation with an overall classification accuracy of 52%. Brackets after Yes/No indicate the number of households (HH) that met the split criteria. Group 1 = poorest, group 2 = middle, and group 3 = wealthiest households correspond to the predicted wealth group using the preceding data splits. G1/G2/G3 indicate the number of households observed in each wealth group at that terminal node. LGP, length of growing season. Level 1, homestead; level 2, agriculture; level 3, common-pool resource area; level 4, wider region for accessibility and length of growing period; bare ag, proportion of bare agricultural land within level 2.

