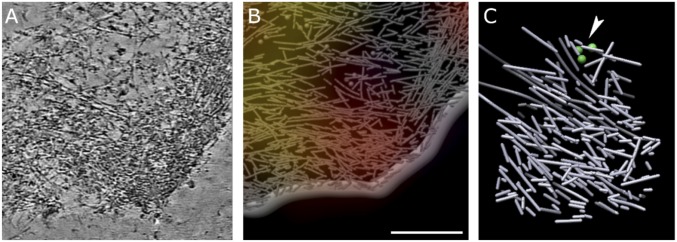
Fig. 2.
The macromolecular organization of cytoskeleton assemblies in regions of high Rac1 activity. (A) A 20-nm-thick slice through tomogram of region with high Rac1 activity. Cell edge is facing the lower right corner. (B) A 3D rendering of traced actin filaments, cell membrane, and ribosomes (spheres) in the region shown in A. The Rac1 activity map is overlaid; red corresponds to high Rac1 activity. (Scale bar, A and B, 300 nm.) (C) Actin filaments extracted from the red region in B. In regions with high Rac1 activity, we consistently observe densely packed, short actin filaments, most of them shorter than 150 nm, with random orientation. Only a very small number of longer filaments and very few ribosomes (green spheres, near arrowhead) are present. Successive slices through cryo-ET reconstruction of region with high Rac1 activity showing short, actin filaments with little mutual alignment can be seen in Movie S3.

