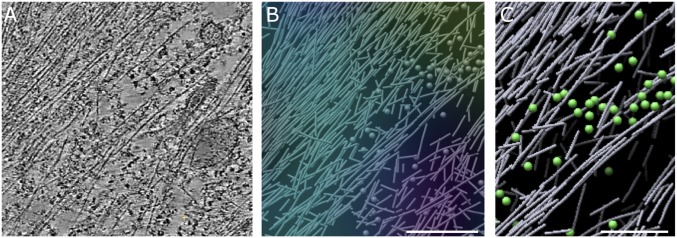
Fig. 4.
Nanometer-scale organization of cytoskeleton assemblies in regions with low Rac1 activity. (A) A 20-nm-thick slice through tomogram of region with low Rac1 activity. (B) A 3D rendering of traced actin filaments (rods) and ribosomes (spheres) in the region shown in A. The Rac1 activity map is overlaid; purple/blue corresponds to low Rac1 activity. (Scale bar, A and B, 300 nm.) (C) Enlarged region. Note the presence of longer, mutually aligned actin filaments (up to >1 µm in length) and ribosomes (green spheres). (Scale bar, 200 nm.) Successive slices through cryo-ET reconstruction of region with low Rac1 activity showing long mutually aligned actin filaments, ribosomes, intermediate filaments, and vesicular structures can be seen in Movie S4.

