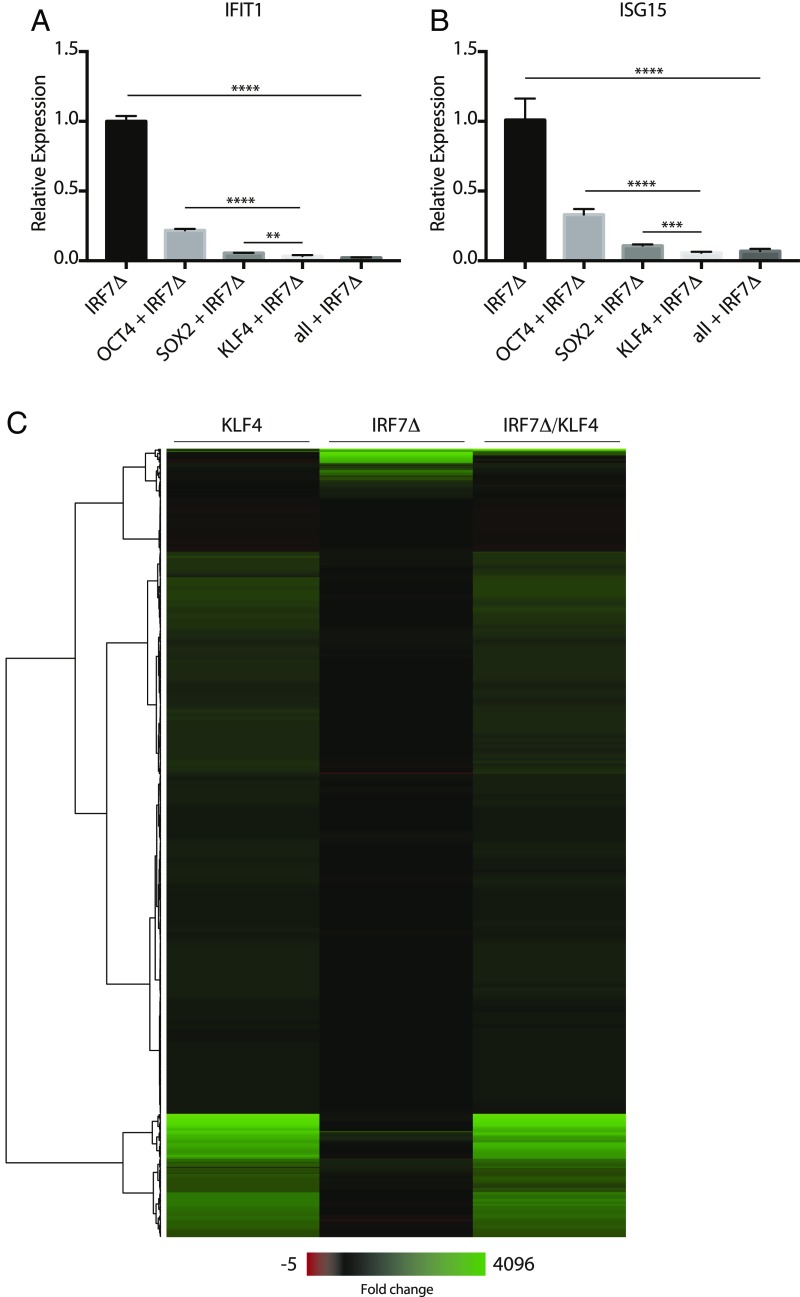
Fig. 3.
Reprogramming factors inhibit IRF7Δ response in fibroblasts. (A and B) Overexpression of OCT4, SOX2, and KLF4 with IRF7Δ in 293T cells. RNA was analyzed by qRT-PCR for IFIT1 and ISG15 mRNA expression, represented as fold change and normalized to IRF7Δ alone. Error bars depict the SD of the mean. Significance was determined by unpaired Student’s t test, where ** to **** denote P values of 0.005 to <0.0001, respectively. Horizontal bars denote comparison groups. (C) Heatmap depicting gene expression profiles from 293T cells transfected with KLF4, IRF7Δ, or KLF4 and IRF7Δ. Heatmap represents genes that are significant (adjusted P value <0.05) and have an abs(log2fold change) >1 in any of the three conditions.

