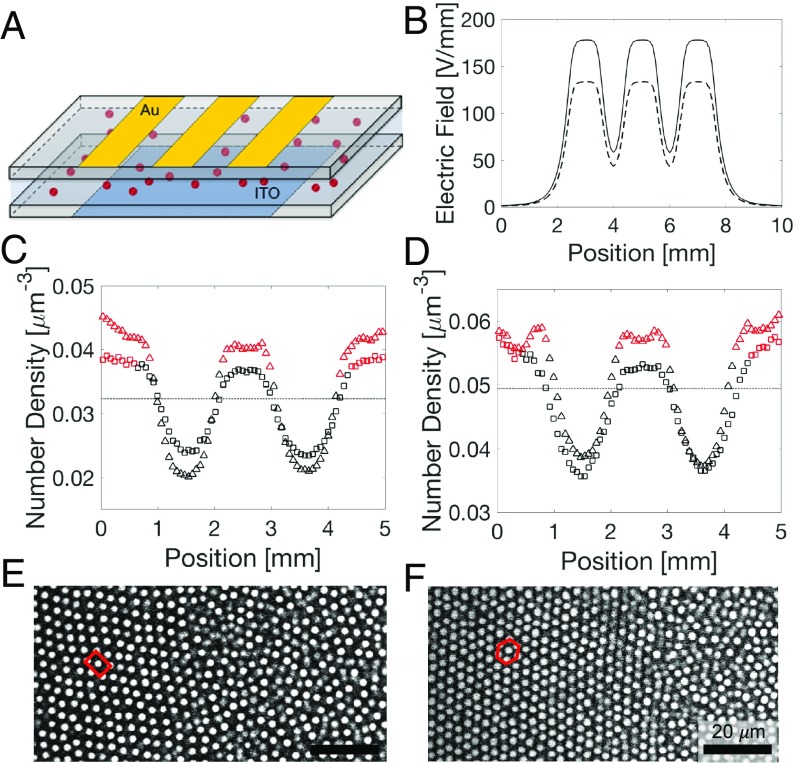
Fig. 1.
Spatial distribution of particles in an electric bottle. (A) Schematic drawing of the electric bottle. (B) Calculated electric field profile at the center plane at 60 V (dashed line) and 80 V (solid line). (C and D) Particle concentration profile at dielectrophoretic equilibrium. (red, crystalline; black, liquid; squares, 60 V; triangles, 80 V; dashed line, original density). (C) The 15 mM AOT suspension forms BCC crystals. (D) The 5 mM AOT suspension forms FCC crystals. (E and F) Confocal images of a crystal–liquid interface taken at the center of the cell. (E) BCC with (110) parallel to the electrode and the BCC–liquid interface perpendicular to the [113] direction. (F) FCC with (111) parallel to the electrode and the FCC–liquid interface perpendicular to the [541] direction.

