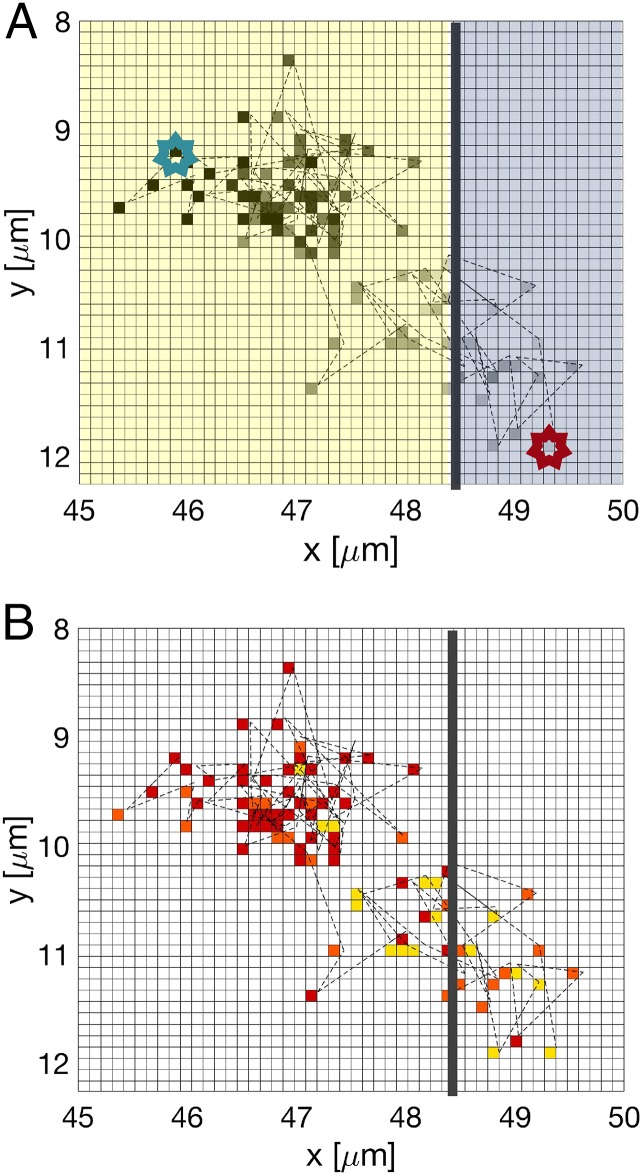
Fig. 3.
A 2D projection of the trajectory of a particle near the BCC–liquid interface at equilibrium. (A) The color gradient of the pixels encodes points along a particle trajectory (red star, starting point; blue star, end point). The average position of the crystal–liquid interface is shown by the dotted line; the crystalline and liquid areas are yellow and blue, respectively. (B) A map of the particle identity (yellow, liquid; orange, interface; red, crystalline) along its trajectory.

