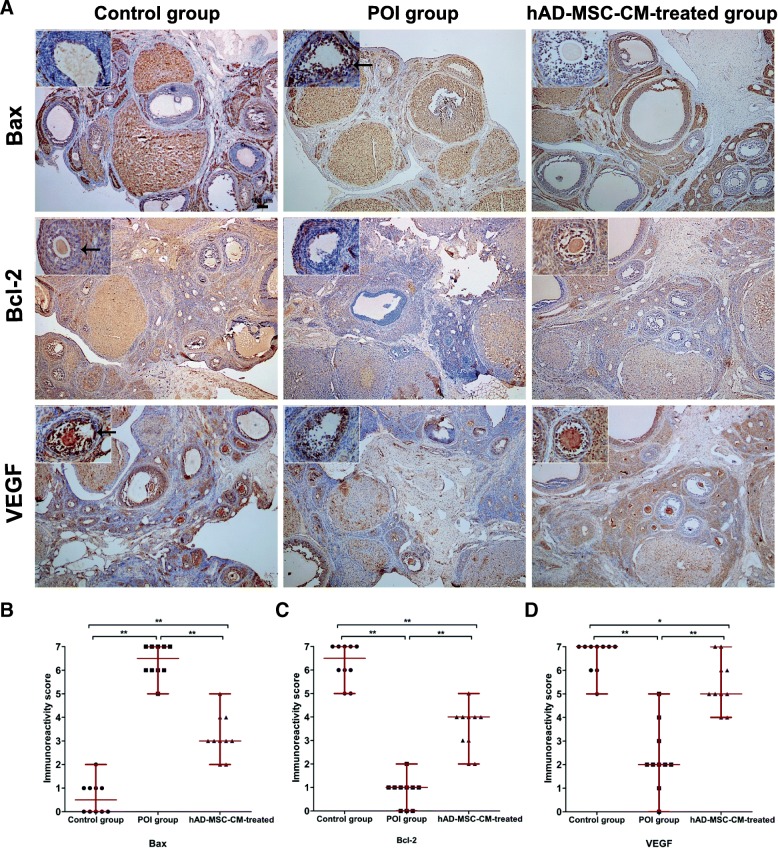
Fig. 9.
The effects of hAD-MSC-CM on the expression of Bcl-2, Bax, and VEGF in the ovaries of POI rats. Representative immunohistochemistry images (a × 40 and × 400) and semiquantitative analysis of Bax, Bcl-2, and VEGF expression (b–d) of ovaries from the three groups are shown (n = 10). Immunostained cells (brown cells) are indicated by black arrows. Each dot in graphs b, c, and d represents the value across ten HPFs randomly chosen from five sections in each group. The bars and error bars indicate the medians and ranges, respectively. *P < 0.05 and **P < 0.01. Scale bars, 100 μm; Scale bars, 20 μm

