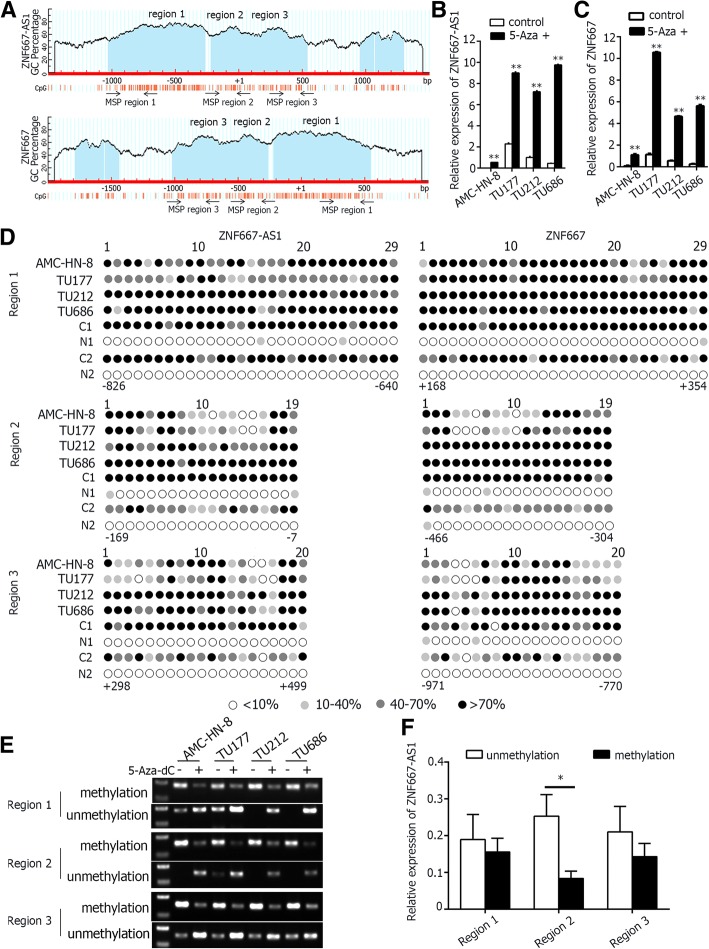
Fig. 3.
Methylation status of ZNF667-AS1 and ZNF667. a. Schematic structure of CpG islands of ZNF667-AS1 and ZNF667, cited from MethPrimer. b. The expression of ZNF667-AS1 increased after treatment with 5-Aza-dC in four laryngeal cancer cell lines. c. The expression of ZNF667 increased after treatment with 5-Aza-dC in four laryngeal cancer cell lines. d. High-resolution mapping of the methylation status of every CpG site in ZNF667-AS1 and ZNF667 CpG islands in four laryngeal cancer cell lines and two pairs of LSCC tissues determined by BGS. Each CpG site is shown at the top row as an individual number. The color of circles for each CpG site represented the percentage of methylation. e. The methylation status of three regions of ZNF667-AS1 detected by MSP analysis in four cancer cell lines with or without 5-Aza-dC treatment. f. Relative expression of ZNF667-AS1 in the tumor tissues with and without methylation of the three regions, which was expressed as mean ± S.D. * P < 0.05

