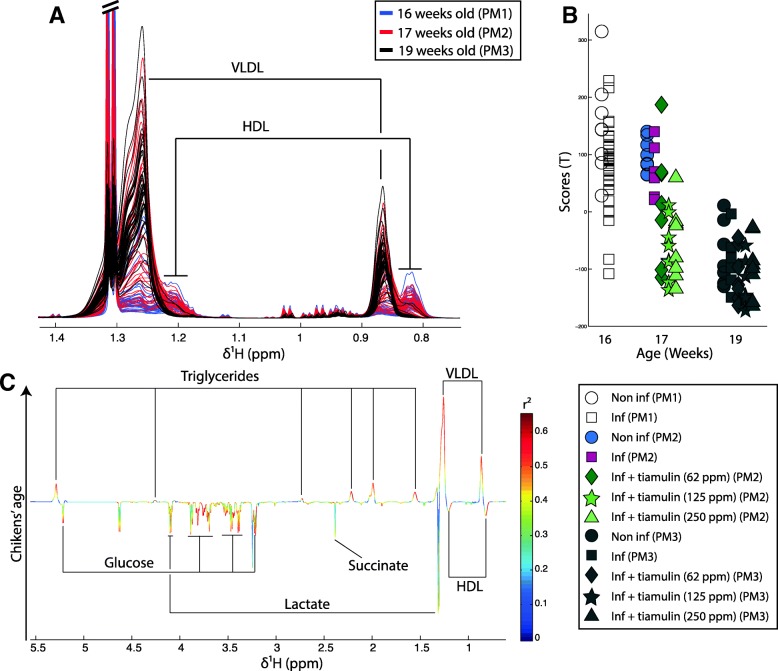
Fig. 4.
Age is related to increased VLDL and decrease HDL and glucose level. a Color-coded plot of the plasma 1D-NMR spectra of 16 weeks old birds (blue), 17 weeks old birds (red) and 19 weeks old birds (black). b Plot of the scores of the O-PLS regression model calculated using 1H-NMR spectra of birds at all time point as a matrix of independent variables and the birds’ age as a predictor. c O-PLS regression coefficient plot related to the birds age

