Fig. 5.
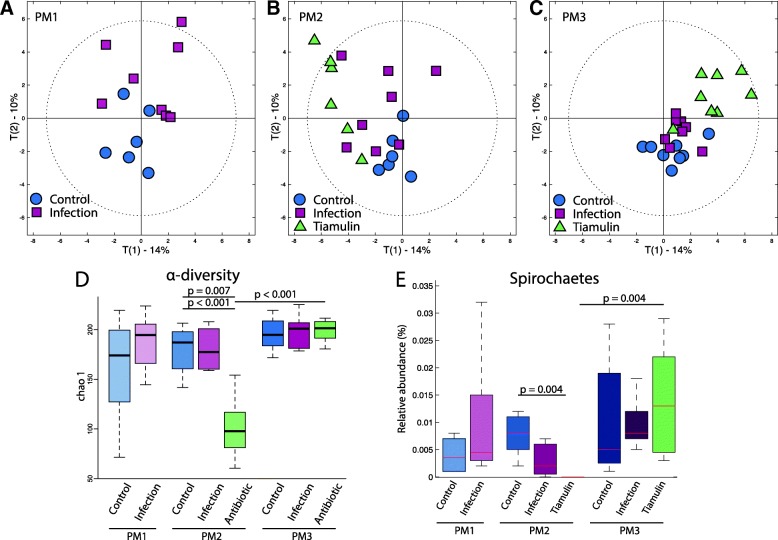
Tiamulin treatment enhances a profound alteration of gut microbial diversity and population. a PCA score plots calculated using the bacterial relative percentage of abundance at family level for all birds but displaying only the scores (n = 8) of control (blue circle) and infected birds (pink square) post infection (T0). b Same PCA score plot than A but displaying only the scores (n = 8) of control (blue circle), infected birds (pink square) and birds treated with highest dose (green triangles) post treatment (T1). c Same PCA score plot than A and B but displaying only the scores of control (blue circle), infected birds (pink square) and treated birds (green triangles) three weeks post treatment (T2). d Alpha diversity calculated for control, infected and treated birds independently of time. e Pie chart presenting the bacterial relative abundance at a phylum level for each group (control, infected and treated) for the three time points chosen in this study

