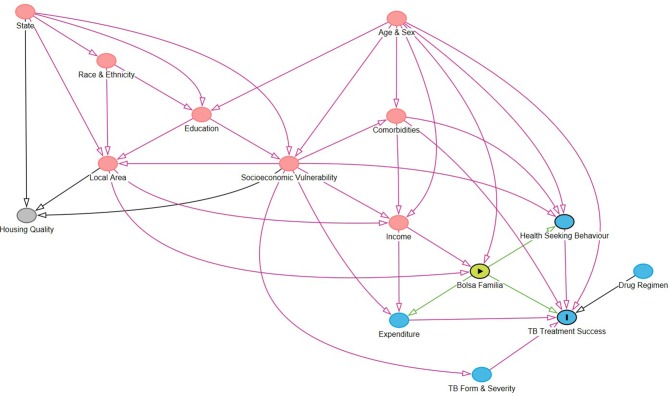
Figure 1.
Directed acyclic graph (DAG) outlining the pathways linking Bolsa Familia with tuberculosis (TB) outcomes. A DAG was built to conceptualise the potentially causal relationships between constructs relevant for measuring the impact of Bolsa Familia on TB treatment success rate. Red nodes are ancestors of both the outcome and the exposure (ie, confounders) while grey nodes are unassociated with the outcome and exposure. Blue nodes are ancestors of the outcome. The DAG links nodes that represent constructs that are measured by covariates table 2).

