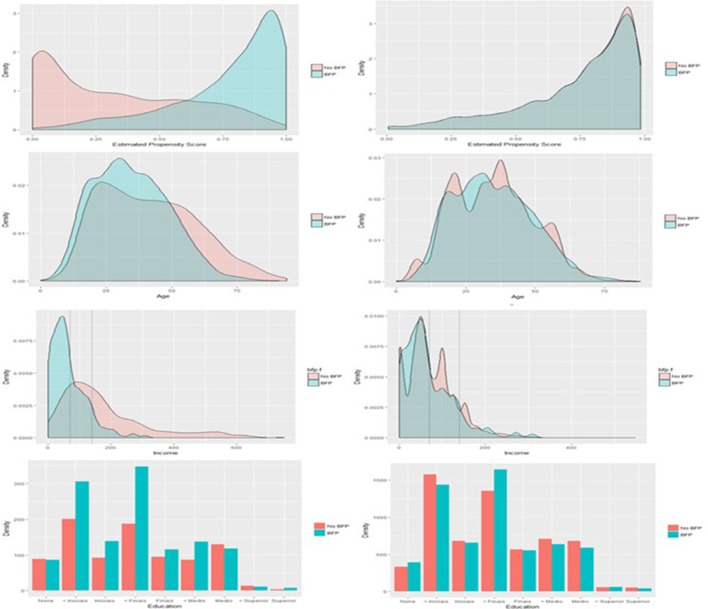
Figure 3.
Overlap in estimated propensity scores between those receiving and those not receiving Bolsa Família Programme (BFP) before matching (top left) and after matching (top right). Overlap has been substantially improved by matching to treated (exposed) patients, suggestive of the groups being balanced on the propensity score. The region of overlap extends between 0 and 1. Also presented are similar plots of variable distribution before and after matching for income, age and schooling (from top to bottom). Dotted lines on the income distributions mark the thresholds for BFP eligibility.

