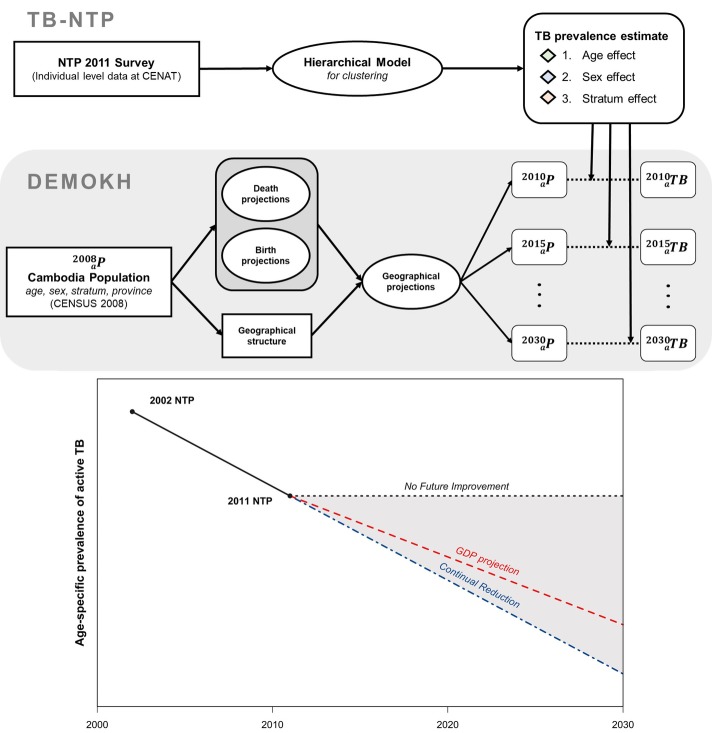
Figure 1.
Methodology and data. Overview of the data sources and model framework in the manuscript is presented in this flow chart. National Tuberculosis Prevalence Surveys (NTP) for 2011 were made available by the National Center for Tuberculosis and Leprosy Control (CENAT) in Cambodia. A summary of the methodology is represented by the model framework: (A) TB-NTP model, and (B) demographic epidemiological model of Cambodia (DEMOKH). The projections to the year 2030 were modelled under three scenarios: no future improvement (should the prevalence rate be maintained at the 2011 rates), continual reduction (should the prevalence rate decline at the same rate from 2002 to 2011 and gross domestic product ( GDP) projections (should the fall in the prevalence rate mirror the projected rises in GDP) as represented in the bottom panel. TB, tuberculosis.

