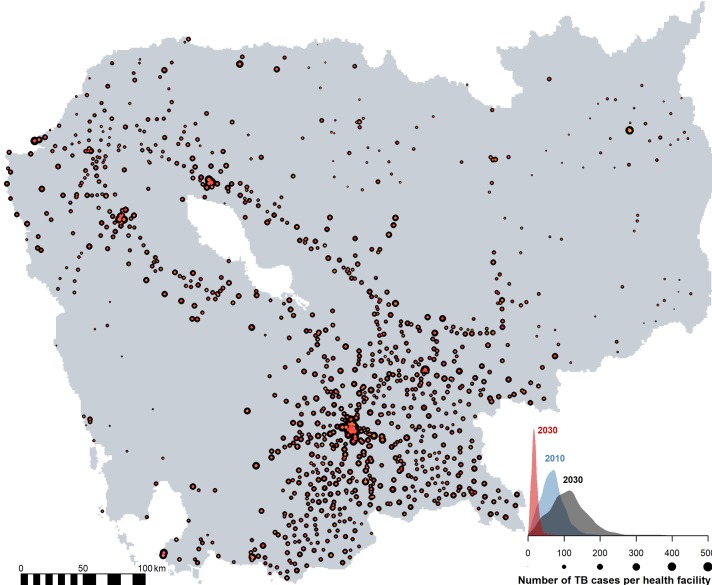
Figure 6.
Projected catchment size of the government healthcare facility in Cambodia in 2030. The size of the points corresponds to the number of active tuberculosis (TB) cases within the catchment area of a government healthcare facility. Two scenarios for 2030 are presented, no future improvement (points in black) and continual reduction (points in hues of red). The burden of the healthcare facility is expected to change over time, with 2010 in blue vs 2030 in dark grey (for the no future improvement scenario) and red (for a continual reduction scenario).

