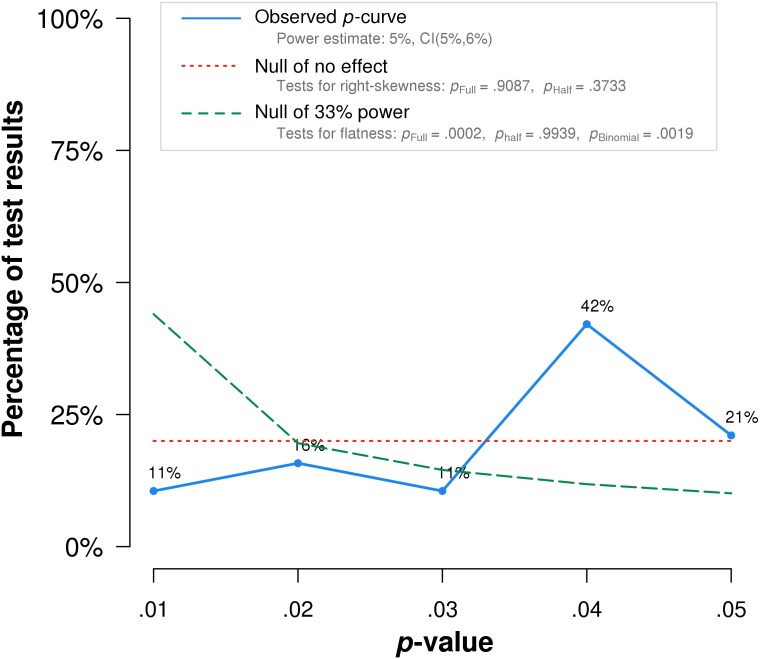
Figure 3. p-curve of robustness test using alternate p-values.
The red dotted line represents the expected p-value distribution when no effect exists. The dashed green line represents the expected distribution when an analysis has 33% true power. The full curve is significantly flatter than the distribution expected with 33% true power (p = .0002), indicated a lack of evidential value.

