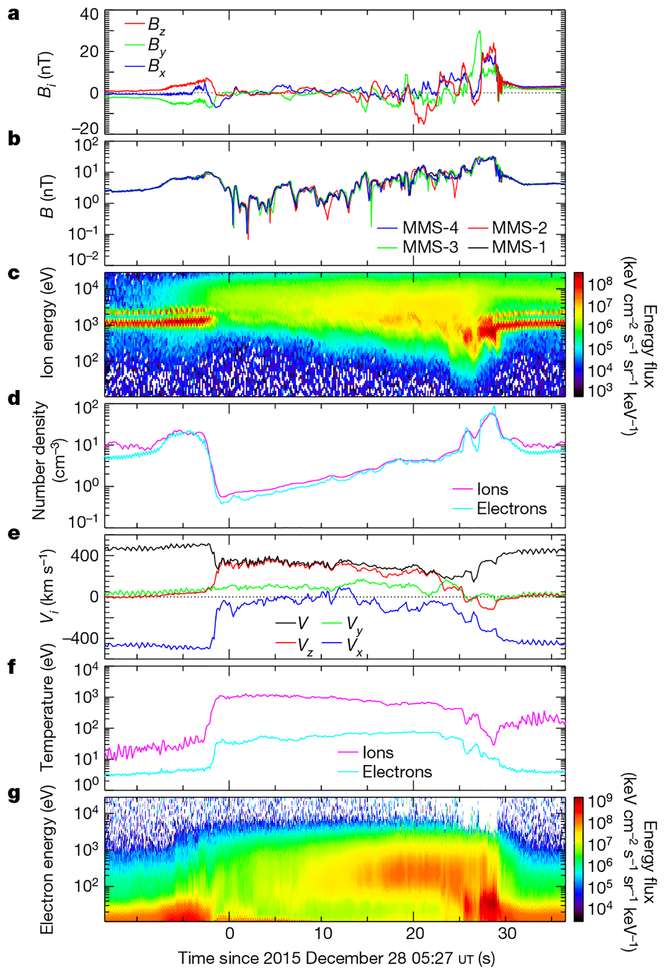
Fig. 1 |. Overview of the MMS burst data during the HFA.
a–g, Quantities shown (all from MMS-1 unless otherwise specified) are the components of the magnetic-field vector B = (Bx, By, Bz) (a) and the magnetic-field strength B = |B| from the flux-gate magnetometers on each of the four spacecraft (b); the omni-directional, averaged energy distributions of the ions from the fast plasma investigation dual ion spectrometer (FPI/DIS) (c); the ion and electron densities (d); the components of the velocity vector of the ions (Vx, Vy, Vz) and its magnitude V = |V| (e); the ion and electron temperatures (f); and the omni-directional, averaged energy distributions of the electrons from the FPI dual electron spectrometer (FPI/DES) (g). With the geometry and multipoint observations of the HFA, its size, expansion rate and motion along the bow shock can be calculated. Using the rotation of the IMF before and after the HFA, we estimate the normal direction of the IMF discontinuity that is responsible for the formation of the HFA to be n = (0.70, −0.44, −0.57) in the geocentric solar ecliptic coordinate system. We calculated the normal direction of the upstream shock of the HFA using co-planarity and multi-spacecraft analysis (Methods), yielding nsh = (0.85, −0.16, −0.53) and nsh = (0.84, −0.44, −0.31), respectively, which are generally consistent. In the solar-wind frame, the HFA shock was expanding upstream (towards the Sun) at about 360 km s−1. When MMS observed the HFA, it was expanding at a rate of 108 km s−1 along the IMF discontinuity normal and was approximately 16,000 km (2.5 Earth radii) in size from edge to edge along the track taken by MMS through the HFA. The geometry of the HFA and the values that we have calculated are critical for enabling comparisons between observed particle acceleration signatures and theory.

