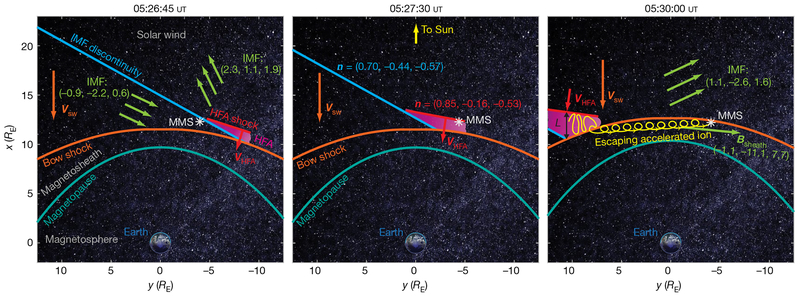
Fig. 3 |. Conceptual scenario for the HFA observed by MMS on 28 December 2015.
Earth is shown at the origin of three two-dimensional cross-sections (approximately in Earth’s equatorial plane; RE is the radius of Earth), which capture the geometry of the system at 05:26:45 ut, 05:27:30 ut and 05:30:00 ut (left to right). The position of MMS is marked by the white asterisk. Slices of Earth’s magnetopause, Earth’s bow shock, the IMF discontinuity and the HFA shock are shown in turquoise, orange, blue and red, respectively. Velocity vectors for the solar wind (Vsw) and the HFA shock (VHFA) are also shown. IMF geometries and vectors are shown in green, and the normal vectors of the IMF discontinuity (n = (0.70, −0.44, −0.57)) and the HFA shock (n = (0.85, −0.16, −0.53)) are also labelled. The core of the HFA is shown in magenta. As the IMF discontinuity and HFA convect with the solar wind, they sweep from right to left across the bow shock, as shown here. The HFA grows in time as it sweeps up and concentrates more and more suprathermal ions in the quasi-parallel foreshock that forms on the upstream side (towards the Sun) of the IMF discontinuity. In the solar-wind rest frame, Earth’s bow shock is moving towards the Sun at Vsw (orange velocity vector) and is perpetually converging on and overtaking the IMF discontinuity and the HFA with its shock (moving at VHFA < Vsw and shown as the red velocity vector). This situation enabled continuous first-order Fermi acceleration to occur during the life of the HFA. In this case, we were afforded a period of fortuitous IMF orientation after MMS observed the HFA: ions that were accelerated within the Fermi acceleration trap between the HFA shock and the bow shock escaped the trap and were then observed by MMS streaming away from the HFA, allowing for direct, observationally constrained comparison between the observations and theory. The yellow spiral trace in the 05:30:00 ut snapshot shows an ion escaping the trap and streaming towards MMS, which is consistent with the observed FEEPS ion and high-energy HPCA He2+ and H+ angular distributions. L is the length scale between the HFA shock and the bow shock, and the average field in the magnetosheath observed by MMS is shown as Bsheath. Image of Earth from NASA’s From Earth to the Solar System collection (image credit: Data-AVHRR, NDVI, Seawifs, MODIS, NCEP, DMSP and Sky2000 star catalogue; AVHRR and Seawifs texture-Reto Stockli; Visualization-Marit Jentoft-Nilsen).

