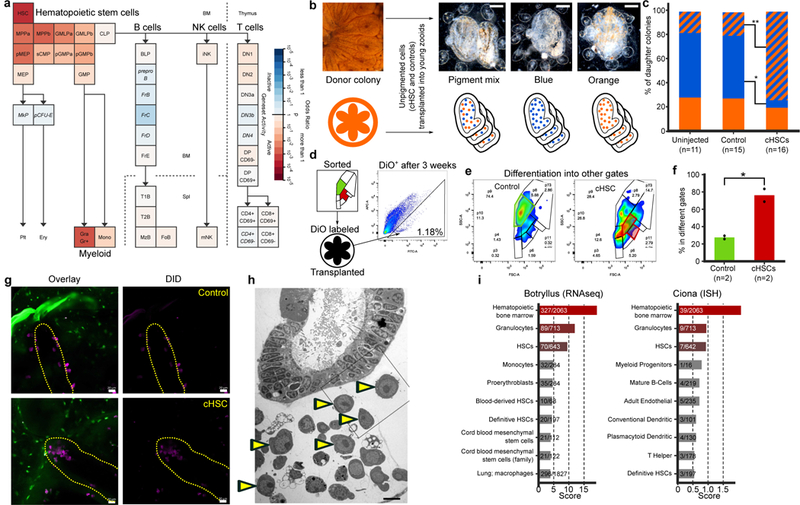
Figure 2. Multilineage Differentiation Capacity, Homing Sites of cHSC and their niches.

a, Geneset Activity Analysis genes upregulated (n=235) in candidate HSCs (CP25, 33, and 34) using the Gene Expression Commons tool on a mouse hematopoiesis model. The enriched populations are HSCs and the myeloid lineage. b, Candidate HSCs and a control cell population (CP18) from an orange pigmented donor colony were transplanted into compatible recipient colonies with blue, orange, or mixture of the two pigmented cells. Upper panel shows live imaging. Scale bar 0.2 mm. c, Significant reduction of the ratio of blue colonies and significant upregulation of the ratio of mixed pigmented colonies (Fisher’s exact test, two tailed, *P=0.006, **P=0.004), 20 days post-cHSC transplantation.d-f, cHSC and a control cell population (CP18) were labeled with DiO and transplanted into compatible colonies (d). Three weeks after transplantation DiO+ cells (d right panel) from the recipient colonies were analyzed by FACS. 24% of the cHSC transplanted cells were detected in their original gate (e right panel in red), the rest were detected in other gates. The majority of the transplanted cells from the control group were detected in the original gate (e left panel in green). Experiment was performed twice. f, percent of the cells from both cHSC and control populations detected in gates different from their original gate, three weeks following transplantation. Experiment was performed on two pools of 5 animals of each population, unpaired T-test, two-tailed, *P=0.024, means. g, cHSC and a control (CP3) were isolated, labeled with DiD (violet) and transplanted into CFSE (green) labeled compatible colonies. Five to ten days following transplantation, only the cHSC populations homed to the endo-niche (5/6) compared to control (0/4). P=0.048 Fisher’s exact test, two tailed, in yellow indicated endostyle, scale bar 20 μm. h, Electron microscopy section of the endostyle and subendostylar sinus (endo-niche). Yellow arrowheads indicate cells with hemoblast (cHSC) morphology. Performed three times. Scale bar 5 μm. i, Enriched blood-associated mammalian cell-types for highly expressed genes in the B. schlosseri endostyle (RNAseq) and the solitary tunicate Ciona robusta endostyle (ISH)21.
