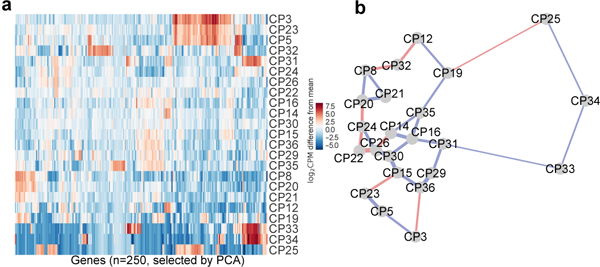
Extended Data Figure 3. B. schlosseri cell population clustering based on transcriptome analysis.

a, 250 genes with the largest weights in the first 11 principal components (explaining 90% of the variance in mean-adjusted log-transformed gene counts) were used to cluster the different cell populations in a heatmap. b, Transcriptome sequencing of B. schlosseri cell populations compared to FACS analysis. 2D projection of the distances between transcriptomes of cell populations based on all differential genes. Lines are drawn between the nearest two neighbors. Blue: corresponds to the FACS adjacency of the populations in the differentiation panel, in red: genetic level proximity that is not predicted by FACS panel adjacency. 20/30 genetic level cellular populations’ proximity were predicted by FACS. Width of lines is inversely proportional to the distances.
