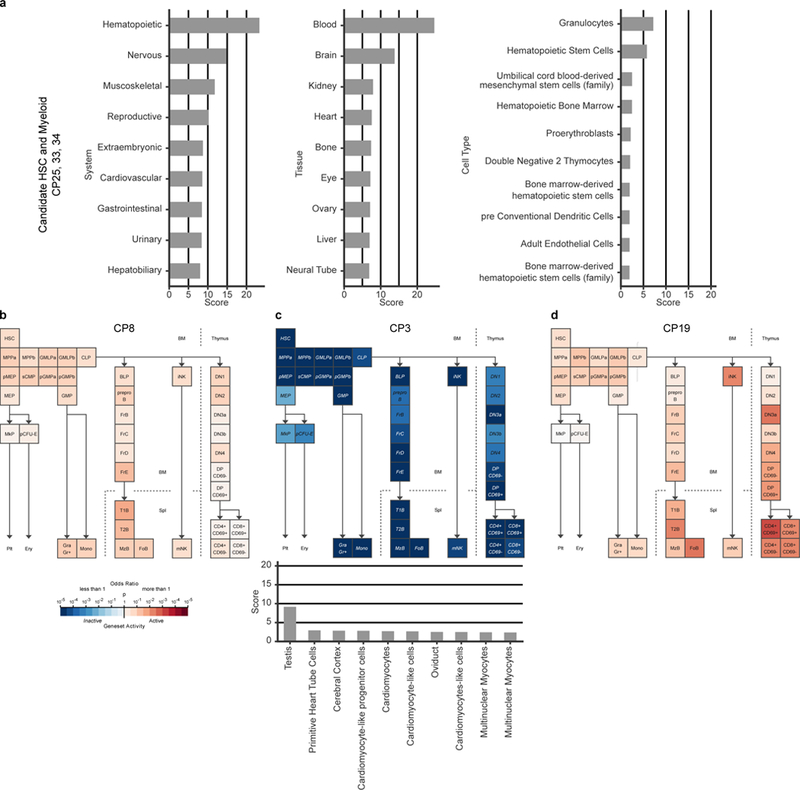
Extended Data Figure 4. Gene expression of B. schlosseri cell populations.

a, Enrichment scores of the top nine systems (left), nine tissues (center), and ten cell types (right) of annotated genes up-regulated in CP33, 34 and 25 using the GeneAnalytics tool compared to human. In systems the hematopoietic system is the highest score, in tissues the blood is the highest score, and within the cells, the granulocytes and HSC have the highest scores. b-d, Geneset Activity Analyses using the Gene Expression Commons tool on a mouse hematopoiesis model of different B. schlosseri cell populations. b, Analysis of CP8 (pigment cells) based on 12 significantly upregulated genes, showing that CP8 is part of the hematopoietic system with gene activity resembling known cell type. c, Analysis of CP3 (small cells) based on 235 significantly upregulated genes, showing that this population is significantly not part of the hematopoietic system. On the bottom: enrichment scores of the top ten tissues using CP3 genes by GeneAnalytics tool compared to human, the highest score is the testis suggesting this population is a gonadal population. d, Analysis of CP19 (enriched with morula cells) based on 96 upregulated genes (p<0.25), showing that CP19 has gene activity as cells in the lymphoid lineage using Geneset analysis.
