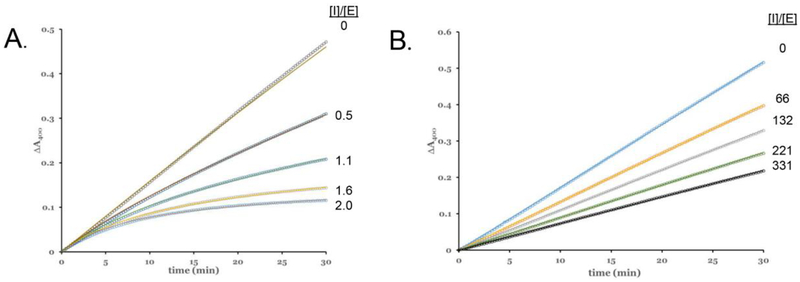
Figure 3. Representative Fitted Inhibition Progress Curves.
(A) WT EapH1 inhibition: assay contained 3.9 nM E lastase, 147 μM MSA2PV-pNA. (B) R89M EapH1 inhibition: 4.5 nM elastase, 156 μM MSA2PV-pNA. The respective inhibitor to enzyme concentration ratios are inset at the right hand side of each panel.

