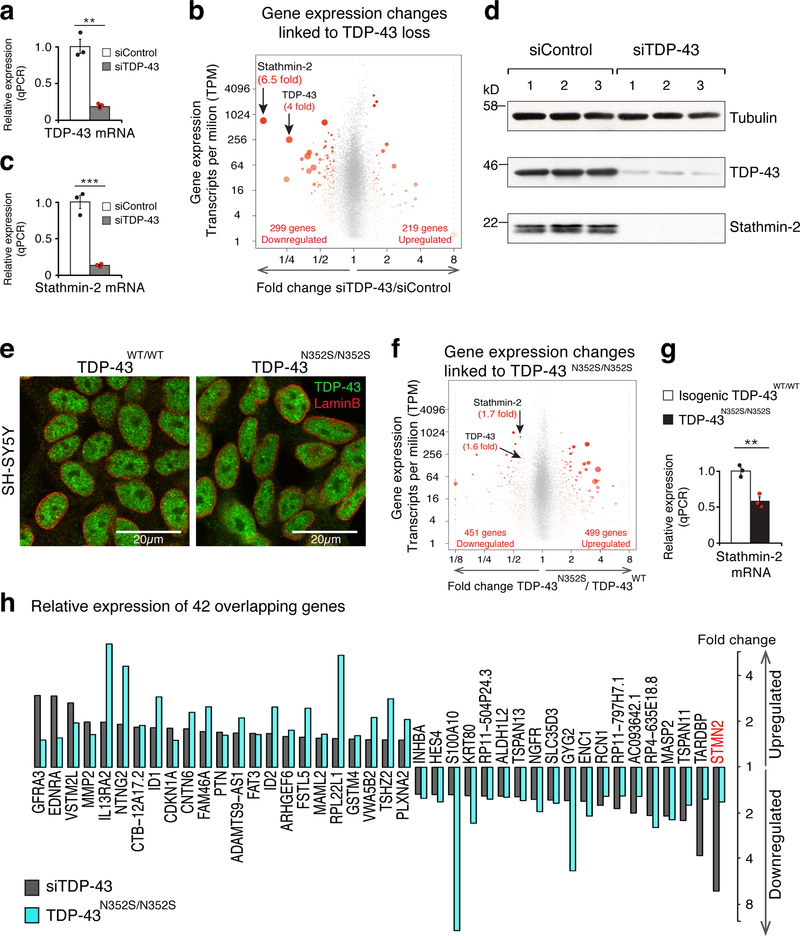
Figure 1. TDP-43 depletion or genome editing in a human neuronal cell line identifies significant reduction in stathmin-2 expression levels.
(a) Quantitative real-time PCR analysis confirming siRNA-mediated reduction of TDP-43 mRNA levels in SH-SY5Y cells. Expression of TRFC and GAPDH mRNAs were used as endogenous controls. Cells were treated with siControl (white bar, black dots, mean=1) or siTDP-43 (gray bar, red dots, mean=0.19) for 96 hours in three biologically independent experiments (two-tailed t-test, P=0.0012, n=3), error bars represent SEM, **P<0.01. (b) Volcano-plot showing differentially expressed genes in SH-SY5Y cells depleted of TDP-43 by siRNA treatment. Genes with significant changes in mRNA levels are represented by red dots (n=3 biologically independent experiments, fold change >1.5 and FDR<0.05) by DESeq2 51. Increased red dot size represents increased statistical significance (measured by FDR<0.05). RNA-seq analysis identified 518 misregulated genes and confirmed 4 fold reduction in TDP-43 mRNA levels. Stathmin-2 mRNA showed the strongest reduction (6.5 fold) upon TDP-43 depletion. Up and down regulated genes’ counts are indicated. Expression values were determined as transcripts per kilobase per million mapped reads (TPM). (c) Quantitative real-time PCR analysis confirming reduction of stathmin-2 mRNA expression levels (mean=0.13) in SH-SY5Y cells treated with siRNA targeting TDP-43 compared to cells treated with siControl (mean = 1) for 96 hours in three biologically independent experiments (two-tailed t-test, P=0.0005, n=3), error bars represent SEM. ***P<0.001 (d) Immunoblotting of TDP-43 and stathmin-2 in SH-SY5Y cells treated with siControl or siTDP43 for 96 hours. α-tubulin served as a loading control. Three biological replicates are shown. (e) Representative Immunofluorescence of TDP-43 (green) and lamin-B (red) in SH-SY5Y lines expressing wild type or mutant TDP-43 by genome-editing. Genotypes are indicated, experiment was reproduced 3 times independently with similar results. For unprocessed blots, see Supplementary Fig. 10. (f) Volcano plot depicting 950 differentially expressed genes identified by genome-wide RNA-seq. Significant changes in mRNA levels between SH-SY5YWT and SH-SY5YN352S/N352S lines are represented by red dots (n=2 biologically independent experiments, fold change > 1.5, FDR<0.05) by DESeq2 51. Increased red dot size represents increased statistical significance (measured by FDR<0.05). Expression values were calculated as transcripts per kilobase per million mapped reads (TPM). (g) Quantitative real-time PCR analysis confirming significant reduction in stathmin-2 mRNA levels between isogenic SH-SY5YWT/WT (white bar, black dots, mean=1) and SH-SY5YN352S/N352S (black bar, red dots, mean=0.58) lines. Expression of TRFC and GAPDH mRNAs were used as endogenous controls (two-tailed t-test, P=0.004, n=3 independent biological experiments), error bars represent SEM. **P<0.01. (h) Expression changes of 42 overlapping genes from figures 1b and 1f are plotted.

