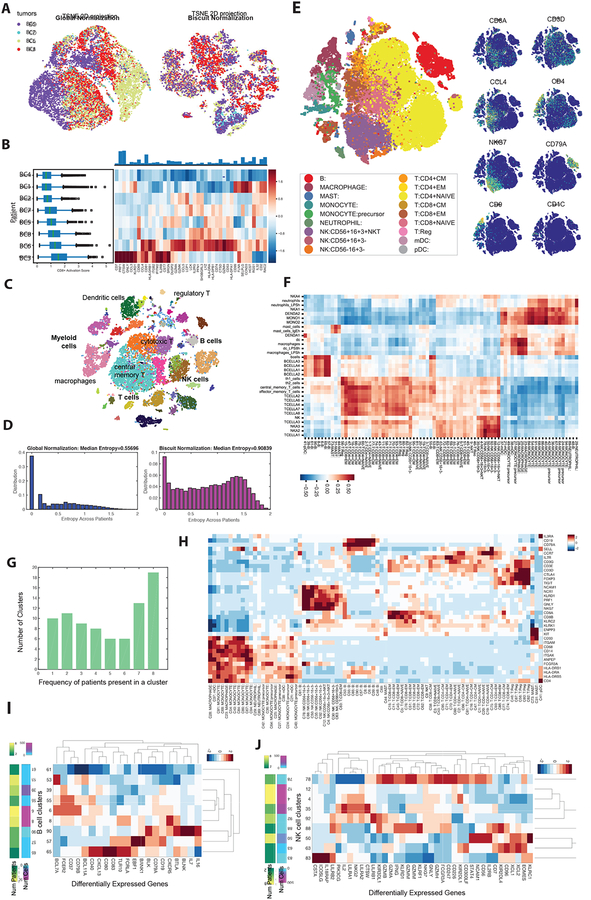
Figure 2:
Unbiased Characterization of the Immune System Across Breast Cancer Patients
(A) t-SNE of immune cells from 4 breast cancer tumors after library-size normalization (left) and Biscuit normalization (right). Cells are colored by tumor. Less mixing of tumors indicates either batch effects or patient-specific cell states.
(B) Left: Boxplots of expression of CD8 T cell activation signature (defined as the normalized mean expression of genes in the activation signature in Table S4) across immune cells from each patient, in the same format as Figure 1E. Expression of T cell activation signature shows variability across patients.
(C) t-SNE map of immune cells from all 8 breast tumors after Biscuit normalization and imputation showing rich structure and diverse cell types. Cells colored by Biscuit clusters and labeled with inferred cell types.
(D) Histogram depicting entropy of the tumor (patient) distribution as a measure of sample mixing. Entropy is computed per cell, based on the distribution of patients in (30-NN) local cell neighborhoods after library-size normalization (left) as compared to Biscuit (right).
(E) t-SNE of complete atlas of immune cells, post-Biscuit normalization, from all patients and tumor, blood, lymph, and contralateral normal tissues, labeled by inferred cell type (left) and normalized expression of 8 immune cell markers (right). Figure S2, S3A, Table S2 present further details on clusters.
(F) Pearson correlations between cluster expression centroids and bulk RNA-seq data from purified immune populations from (Jeffrey et al., 2006; Novershtern et al., 2011).
(G) Histogram of frequency of patients contributing to each cluster; 19 clusters are present in all 8 patients and 10 clusters are patient-specific.
(H) Z-score normalized expression of canonical and cell type markers across clusters.
(I,J) Differentially expressed genes (DEGs) in B cell (I) and NK cell (J) clusters, standardized by z-scores within cell type to highlight clusters with higher or lower expression of the marker compared to the average B or NK cluster (all DEGs are presented in Table S3).

