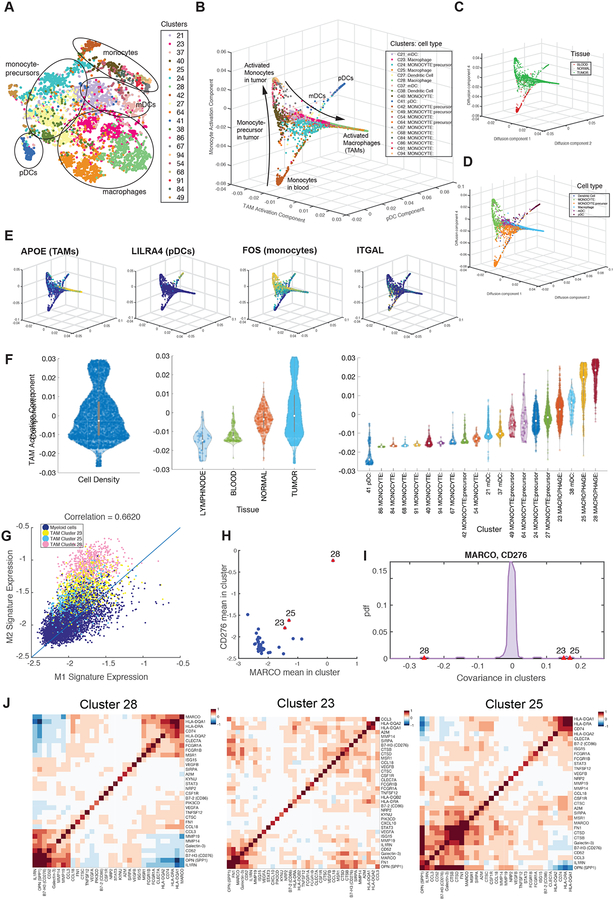
Figure 7:
Detailed Characterization of Myeloid Cells
(A) t-SNE map projecting myeloid cells from BC1–8 patients (all tissues). Cells are colored by Biscuit cluster and cell types are labeled based on bulk RNA-seq correlation-based annotations.
(B through E) Projection of myeloid cells on macrophage activation, pDC, and monocyte activation diffusion components, colored by (B) cluster, (C) tissue, (D) cell type, and (E) expression of example lineage-demarcating genes.
(F) Violin plots showing the density of cells along macrophage activation component and organized by overall density (left panel), tissue type (middle panel), and cluster (right panel). See Figure S7 for other components.
(G) Scatter plot of normalized mean expression of M1 and M2 signatures per cell (dot); cells assigned to TAM clusters have been highlighted by cluster.
(H) Scatterplot of mean expression of MARCO and CD276 in myeloid clusters; each dot represents a cluster; TAM clusters are marked in red, indicating high expression of both markers in macrophage clusters.
(I) Distribution of covariance between MARCO and CD276 across all myeloid clusters. TAM clusters are marked in red and present substantial outliers. See Figure S7F for similar computation on the raw, un-normalized data, verifying the result.
(J) Heatmaps showing covariance patterns of select macrophage marker genes in 3 TAM clusters.

