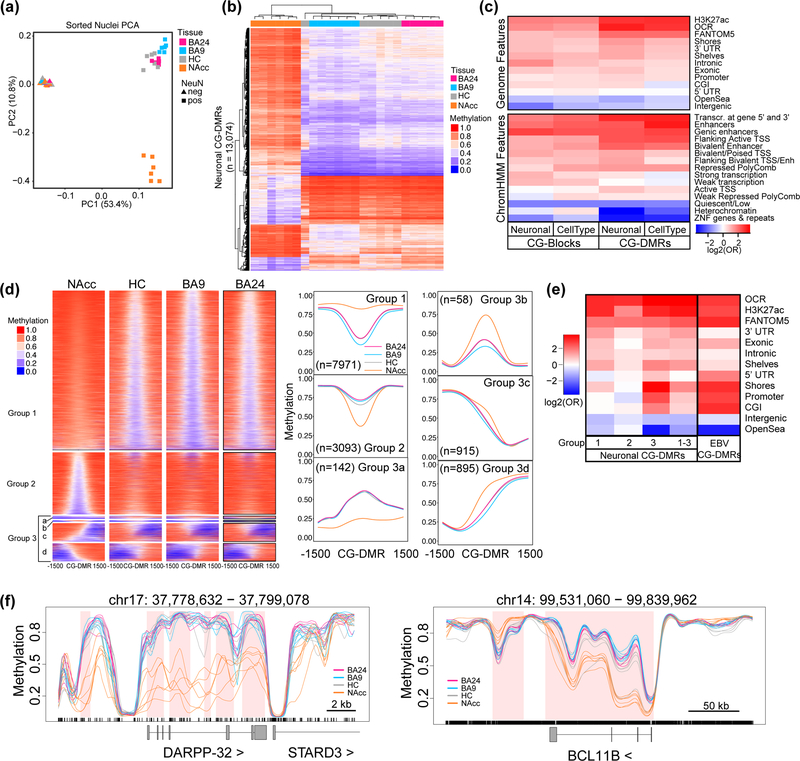
Figure 1. Neuronal nuclei isolated from different brain regions display widespread differences in CpG methylation.
DNA methylation was assessed in samples from four tissues: anterior cingulate cortex (BA24; pink), prefrontal cortex (BA9; blue), nucleus accumbens (NAcc; orange), and hippocampus (HC; grey). (a) Principal component analysis (PCA) of distances derived from average autosomal CpG methylation (in 1 kb intervals) in NeuN+ and NeuN- nuclei from each brain region; each point is a sample (n=6 for BA9,HC,NAcc in both NeuN+ and NeuN-; for BA24, n=5 for NeuN+ and n=4 for NeuN-). (b) Hierarchical clustering of samples based on the average methylation per sample of the neuronal CG-DMRs (n=13,074). (c) Log odds ratios for the enrichment of CpGs within cell type (NeuN+ vs NeuN-) and neuronal (NeuN+) CG-DMRs and blocks compared to the rest of the genome for genomic features. Gene models from GENCODE (promoters, intronic, exonic, 5’UTR, 3’UTR, intergenic), CpG islands (CGIs) and related features from UCSC (shores, shelves, OpenSea), putative enhancer regions (H3K27ac30, FANTOM531), open chromatin regions (OCRs) from this study, and brain-specific ChromHMM15 annotations (core 15-state model). (d) Average methylation for NeuN+ nuclei over a 3 kb window centered on the neuronal CG-DMRs. CG-DMRs were grouped by k-means clustering based on their methylation patterns. Metagene plots for each group are shown to the right with the number of CG-DMRs in each group indicated. (e) Heatmap as in (c) showing enrichment within neuronal CG-DMRs from groups 1–3 and CG-DMRs from EBV transformed B cells33. (f) Example CG-DMR (top) and CG-block (bottom) showing average methylation values for NeuN+ nuclei from each tissue as indicated. Regions of differential methylation are shaded in pink.

