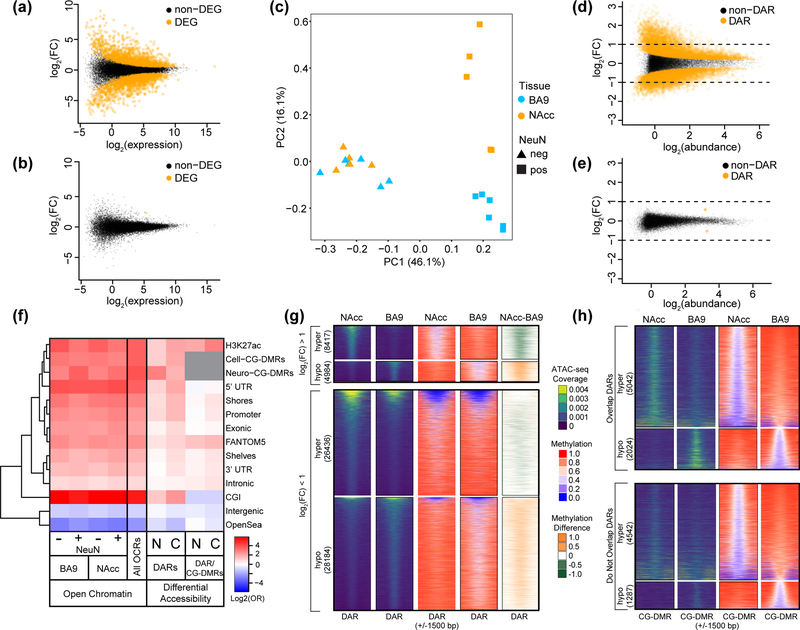
Figure 3. Chromatin accessibility landscape differs between neuronal nuclei isolated from the nucleus accumbens and prefrontal cortex.
Mean-difference plots of gene expression data comparing NAcc to BA9 in (a) NeuN+ nuclei and (b) NeuN-. Differentially expressed genes (DEGs) are shown in orange. (c) Principal component analysis of open chromatin regions [log2(counts per million)] in NeuN+ and NeuN- nuclei from NAcc or BA9. For (a-c), NeuN+ nuclei were from: NAcc, n = 5 individuals and BA9, n = 6 individuals; for NeuN-: NAcc, n = 4 individuals and BA9, n = 5 individuals. (d,e) Mean-difference plots of peak accessibility data comparing: NAcc to BA9 in either (d) NeuN+ nuclei, or (e) NeuN- nuclei. Differentially accessible regions (DARs) are shown in orange. Data shown in (d,e) were randomly sampled (20% of DARs, 10% of non-DARs). (f) Log odds ratios for the enrichment of open chromatin regions (OCRs), DARs, or the intersection of DARs and differentially methylated regions (CG-DMRs) (cell type or neuronal as indicated) in different genomic features. OCRs and DAR/CG-DMR intersection enrichments were calculated in comparison to the rest of the genome while DARs were compared to non-DARs. Gene models from GENCODE (promoter, intronic, exonic, 3’UTR, 5’UTR, intergenic), CpG islands and related features from UCSC (CGI, shores, shelves, OpenSea), and putative enhancer regions (brain-specific H3K27ac30, FANTOM531). (g) ATAC-peak coverage for NeuN+ nuclei from NAcc or BA9 over a 3 kb window centered on neuronal DARs (n=68,201). Neuronal DARs were annotated based on log fold change (greater or less than one) and direction (“hyper” - more accessible in NAcc; “hypo” – more accessible in BA9). The number of neuronal DARs in each category is indicated. Average CpG methylation values and the methylation difference (NAcc minus BA9) for these regions are also shown. (h) As in (g), but centered on neuronal CG-DMRs (n=12,895) identified between NeuN+ nuclei from NAcc and BA9. Neuronal CG-DMRs are separated by those that overlap neuronal DARs and those that do not as indicated. The number of neuronal CG-DMRs in each category is indicated.

