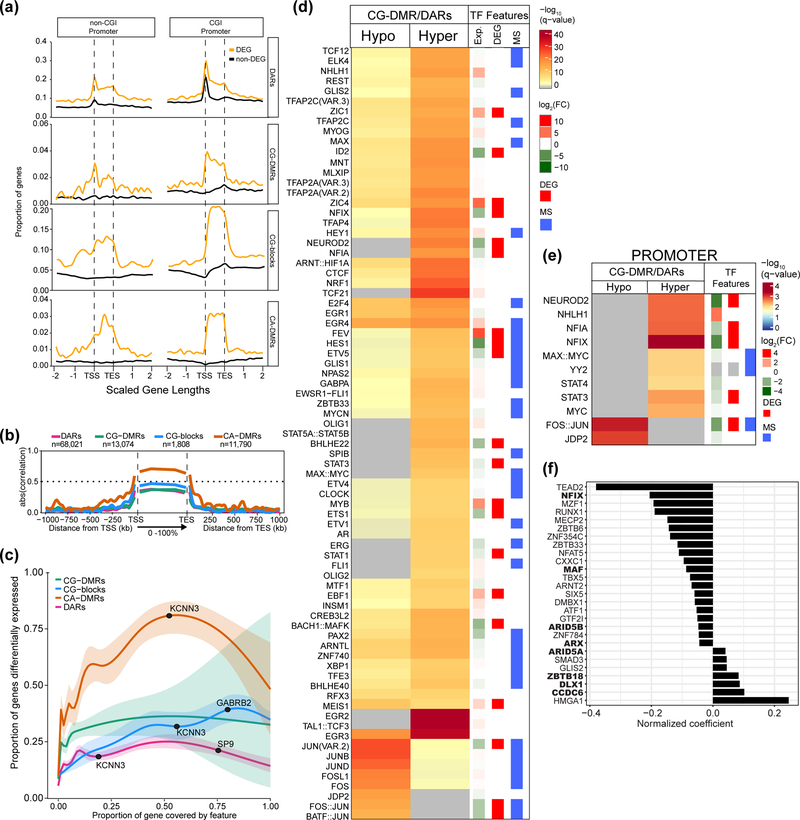
Figure 4. Differential gene expression is strongly associated with neuronal CA-DMRs.
Regions where neuronal CG-DMRs and DARs intersect are enriched in binding sites for transcription factors (TFs) associated with synaptic activity. (a) Proportion of protein coding genes (n=19,823) with a differential epigenetic feature in each bin around gene bodies. Each gene length is split into 100 bins and data extend two gene lengths up and downstream. Differentially expressed genes (DEGs) are indicated. (b) Absolute Pearson correlation values of differential epigenetic features with protein coding gene expression across scaled gene bodies with each gene length split into 100 bins (0–100%); data extend 1 Mb up and downstream in 1 kb bins. The sample for the Pearson correlation in each bin is the subset of features that overlap that bin and, therefore, the sample size for which Pearson’s correlations were determined varies for each bin and feature. (c) Estimated probability (with 95% CI) that a gene is differentially expressed in terms of the proportion of the gene covered by differential epigenetic features (Methods). Example DEGs are annotated. (d) Enrichment of TFs whose motifs were enriched in DARs that overlap hypo- (n=11,734) or hypermethylated CG-DMRs (n=14,463) in NAcc compared to BA9. Differentially expressed TFs in NAcc vs. BA9 are shown by red bars (see Methods for description of RNA-seq analysis). TFs whose binding is influenced by DNA methylation (as determined in47) are indicated with a blue bar. (e) As in (d), showing TFs with motifs enriched where DAR/CG-DMRs overlap promoters (hyper, n=2,618; hypo, n=1,435). Significance determined using one-sided Fisher’s test in (d,e). (f) Bar plot showing the predicted impact of TFs on gene expression (normalized coefficient) for each TF with a binding site within a DAR located within 5 kb of a gene. Large values denote a higher impact of the TF on differential gene expression. Bold type indicates that the TF is differentially expressed between NAcc and BA9.

