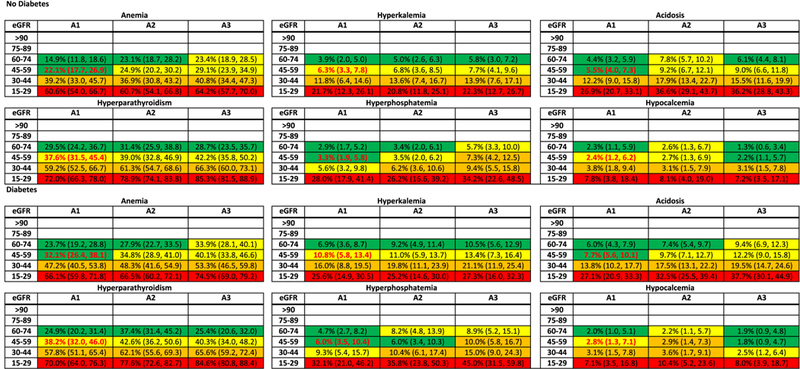
Figure 3.

Meta-analyzed adjusted prevalence (25th and 75th percentile cohort) of abnormalities (categorical laboratory measures) in chronic kidney disease by diabetes status. The adjusted prevalence of each abnormality at each estimated glomerular filtration rate (eGFR) and albuminuria stage was computed as follows: first, we converted the random-effects weighted adjusted mean odds at the reference point (eGFR, 50 mL/min/1.73 m2) into a prevalence estimate. To the reference estimate, we applied the meta-analyzed odds ratios to obtain prevalence estimates at eGFRs of 95, 80, 65, 35, and 20 mL/min/1.73 m2 for each stage of albuminuria with and without diabetes. The prevalence estimates were adjusted to 60 years old, half men, nonblack, 20% history of cardiovascular disease, 40% ever smoker, and body mass index of 30 kg/m2. The 25th and 75th percentiles for predicted prevalence were the estimates from individual cohorts in the corresponding percentiles of the random-effects weighted distribution of adjusted odds. This was done separately for each abnormality. Note that the cohorts included in the analyses of each abnormality may differ based on data availability. For example, the cohort in the 25th percentile of anemia may not be the same as the cohort in the 25th percentile of hyperparathyroidism. Color coding is based on odds ratio quartile within each abnormality. Bold red font indicates the reference cell. Definitions of each abnormality are as follows: anemia: Hgb, male < 13 g/dL, female < 12 g/dL; Hct, male < 39%, female < 36%; hyperkalemia: potassium > 5 mmol/L; acidosis, bicarbonate < 22 mmol/L; hyperparathyroidism, intact parathyroid hormone > 65 pg/mL; hyperphosphatemia, phosphorus > 4.5 mg/dL; and hypocalcemia, corrected calcium < 8.5 mg/dL.
