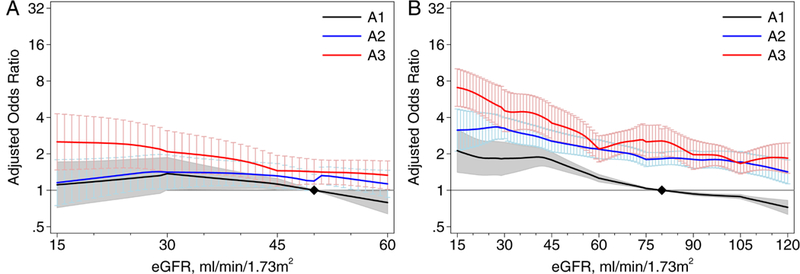
Figure 4.

Association between estimated glomerular filtration rate (eGFR) and hypertension by albuminuria stages in (A) chronic kidney disease (CKD) cohorts and (B) general population and high-risk cohorts. Abbreviations: A1, A2, A3 refer to albuminuria stages: A1, <30 mg/g; A2, 30-299 mg/g; and A3, 300+ mg/g. The y-axis refers to the meta-analyzed adjusted odds ratio and 95% confidence interval compared to a reference of eGFR of 50 (80 in the right graph) mL/min/1.73 m2 in A1 (black diamond). In analyses of the general population/high-risk cohorts, eGFR was modeled as a 7-piece linear spline with knots at 30, 45, 60, 75, 90, and 105 mL/min/1.73 m2; the reference point in continuous analysis was set at 80 mL/min/1.73 m2. In analyses of CKD pop-ulations, eGFR was modeled as a 3-piece linear spline with knots at 30 and 45 mL/min/1.73 m2; the reference point in continuous analysis was set at 50 mL/min/1.73 m2.
